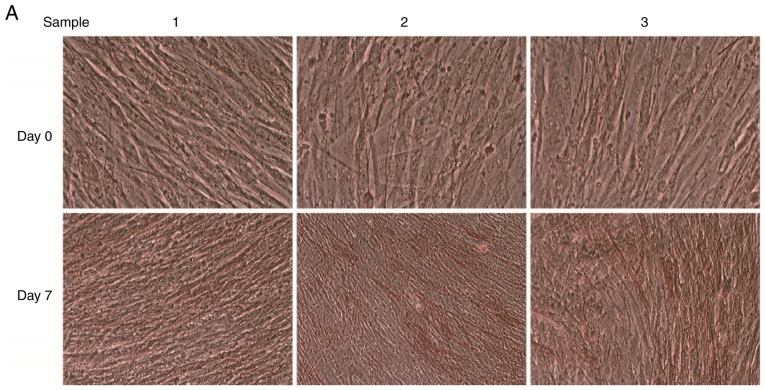
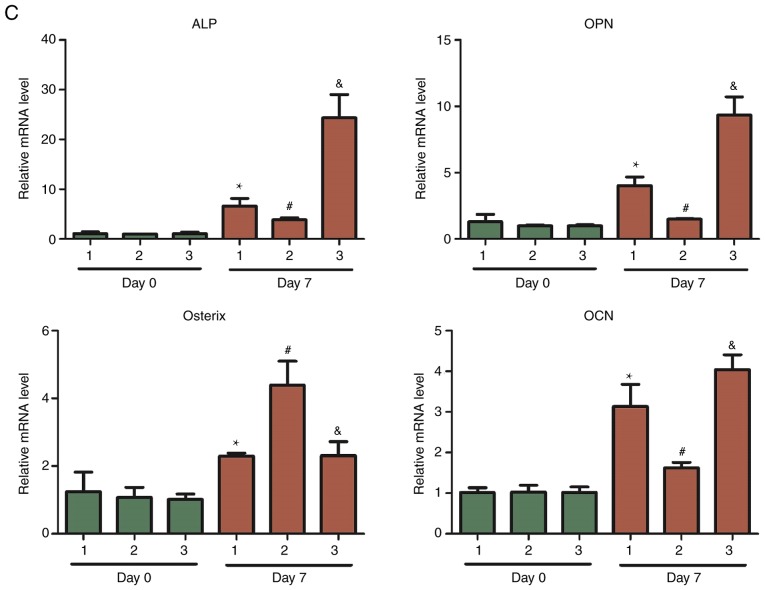
Figure 1.
Osteogenic differentiation of hBMSCs. (A) ALP staining (magnification, ×40). (B) Alizarin Red staining (magnification, ×40). (C) Expression levels of the osteogenesis-specific transcription factors ALP, OPN, Osterix and OCN. *P<0.05 vs. Day 0 sample 1; #P<0.05 vs. Day 0 sample 2; &P<0.05 vs. Day 0 sample 3.


