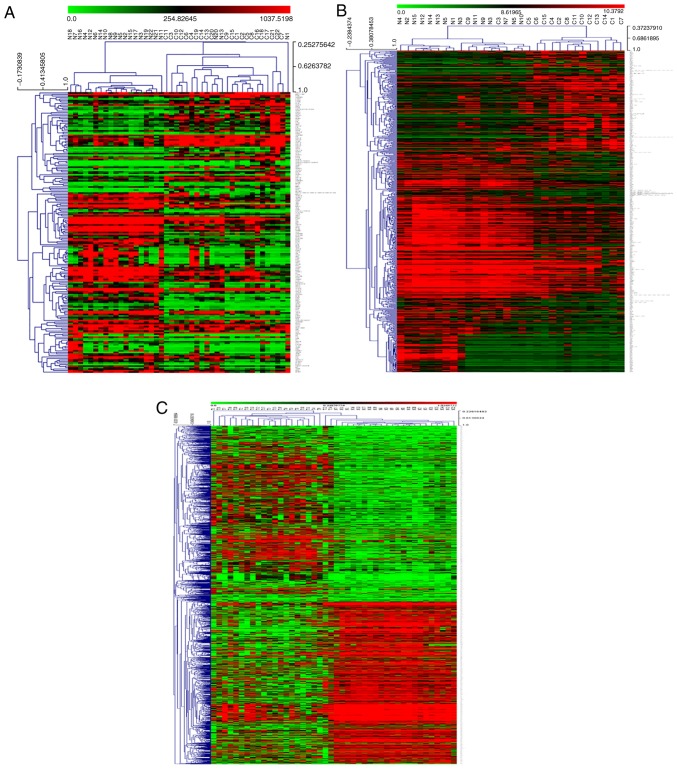
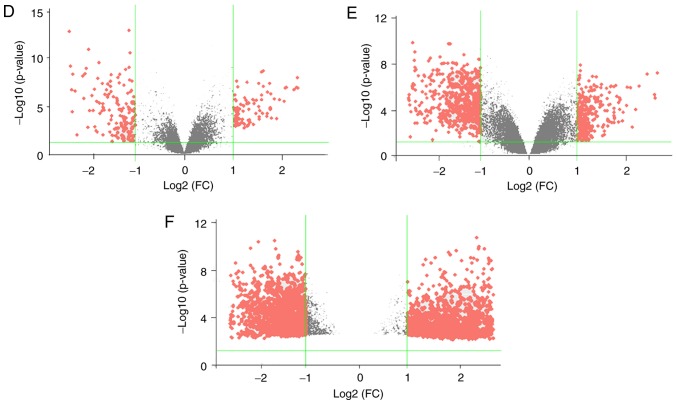
Figure 1.
Visual presentation of the differentially expressed genes (|logFC|≥1; P≤0.05) included in the three data series examined in the present study. Hierarchical clustering graphs of genes in the (A) GSE6631, (B) GSE58911 and (C) GSE83519 data series are shown. Rows represent the mRNAs and columns represent the samples. Red and green represent upregulated and downregulated genes in cancerous tissues compared with paired adjacent normal samples, respectively. Volcano plots for (D) GSE6631, (E) GSE58911 and (F) GSE83519 data series are displayed. The x-axis represents the log2 of FC and the y-axis represents the negative log10 of the P-value. Red and grey foci on the graphs represent differently and non-differentially expressed mRNAs, respectively, in head and neck squamous cell carcinoma. FC, fold change.


