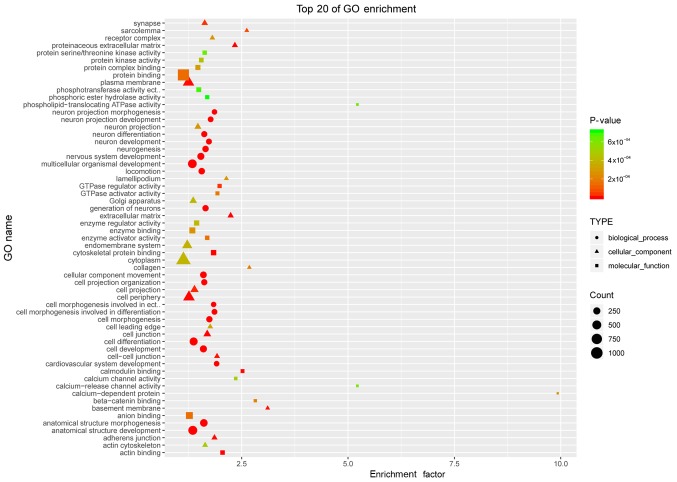
Figure 3.
GO analysis of differential methylated genes (β>0.14; P<0.05). X-axis, enrichment factor; Y-axis, GO category. The red represents small P-values and the green represents the larger ones. A round node represents a biological process, the triangle represents a cellular component and a square represents a molecular function. The top 20 GO terms are presented. GO, Gene Ontology; ATPase, adenosine triphosphatase; GTPase, guanosine triphosphatase.

