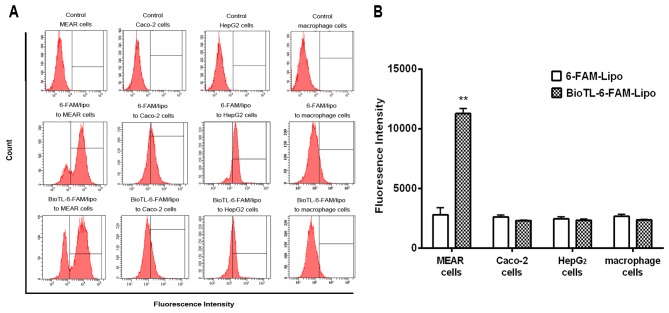
Figure 4.
Effect of MEAR, Caco-2, HepG2 or macrophage cells on the uptake of 6-FAM/Lipo or BioTL-6-FAM/Lipo. (A) Quantitative flow cytometry analysis of cells following treatment for 3 h. (B) Flow cytometry analysis of fluorescence intensity. All values are presented as the mean ± standard deviation. **P<0.01 vs. 6-FAM-Lipo-treated MEAR cells. MEAR, BNL 1ME A.7R.1 cells; 6-FAM, 6-carboxy fluorescein; FITC, fluorescein isothiocyanate; lipo, liposomes.

