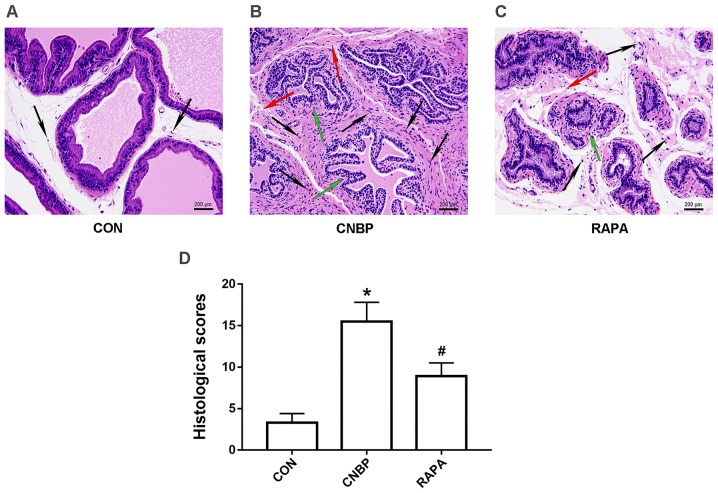
Figure 2.
Histological alterations and quantitative analysis of histology of rat prostate tissues from the three groups. Representative histological images are presented, following hematoxylin and eosin staining (magnification, ×200; scale bar, 200 µm) of the prostates of rats from the (A) CON, (B) CNBP, and (C) RAPA-treated groups. (D) Quantitative analysis of the histological alterations in the different groups. Data are presented as the mean ± standard deviation. The black arrows indicate inflammatory cells in the prostate tissues of the rats; the green arrows indicate glandular epithelial degeneration in the prostate tissues of the rats; the red arrows indicate the interstitial edema in the prostate tissues of the rats. *P<0.05 vs. the CON group; #P<0.05 vs. the CNBP group. CON, control; CNBP, chronic non-bacterial prostatitis; RAPA, rapamycin.

