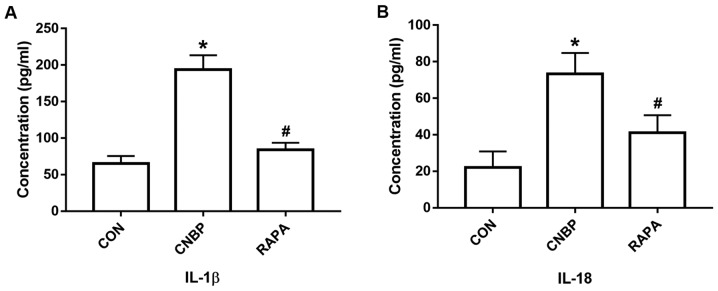
Figure 4.
Levels of serum IL-1β and IL-18 in rats from different groups. The serum concentrations of (A) IL-1β and (B) IL-18, as revealed by ELISA, in rats from the three groups. Data are expressed as the mean ± standard deviation. *P<0.05 vs. the CON group; #P<0.05 vs. the CNBP group. IL, interleukin; CON, control; CNBP, chronic non-bacterial prostatitis; RAPA, rapamycin; ELISA, enzyme-linked immunosorbent assay.

