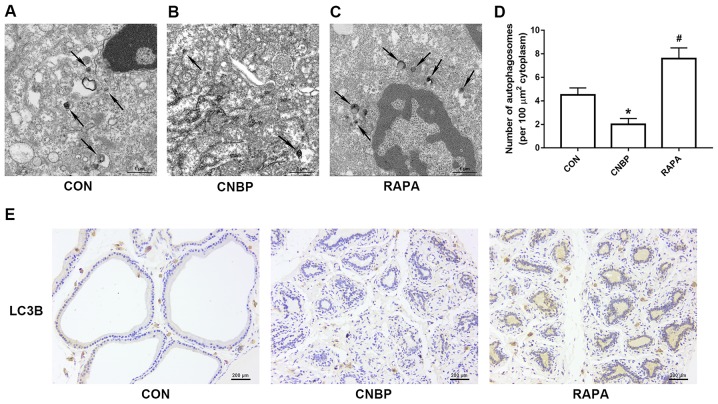
Figure 6.
Ultrastructural alterations due to autophagy and cells positively stained for LC3B in rats of the three different groups, as detected by TEM and IHC analyses. Representative TEM images of autophagosomes in the (A) CON, (B) CNBP and (C) RAPA groups (magnification, ×5,000; scale bar, 1 µm). The black arrows indicate autophagosomes with a double membrane in the prostates of rats. (D) Quantitative analysis of autophagosomes in the different groups. (E) Representative IHC images of LC3B in the three groups (magnification, ×200; scale bar, 200 µm). Data are expressed as the mean ± standard deviation. *P<0.05 vs. the CON group; #P<0.05 vs. the CNBP group. CON, control; CNBP, chronic non-bacterial prostatitis; RAPA, rapamycin; TEM, transmission electron microscopy; IHC, immunohistochemistry; LC3B, microtubule-associated protein 1 light chain 3β.

