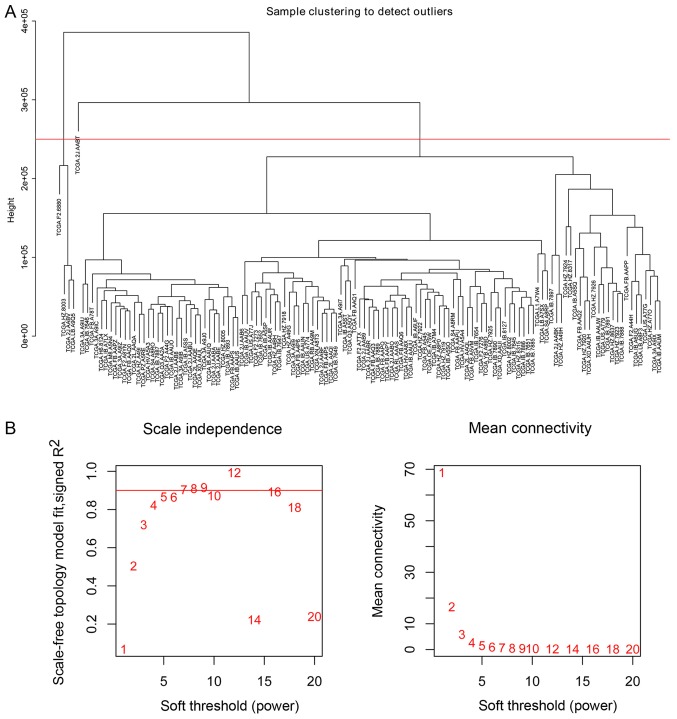
Figure 1.
Sample clustering to detect outliers and analysis of network topology for various soft threshold powers. (A) Cluster dendrogram of 129 samples based on their Euclidean distance. The red line represents the cut-off of data filtering in the step of data processing. Five sample outliers were removed. (B) Analysis of the scale-free fit index and the mean connectivity for various soft-thresholding powers (β). The red line represents the cut-off value (R2=0.9).

