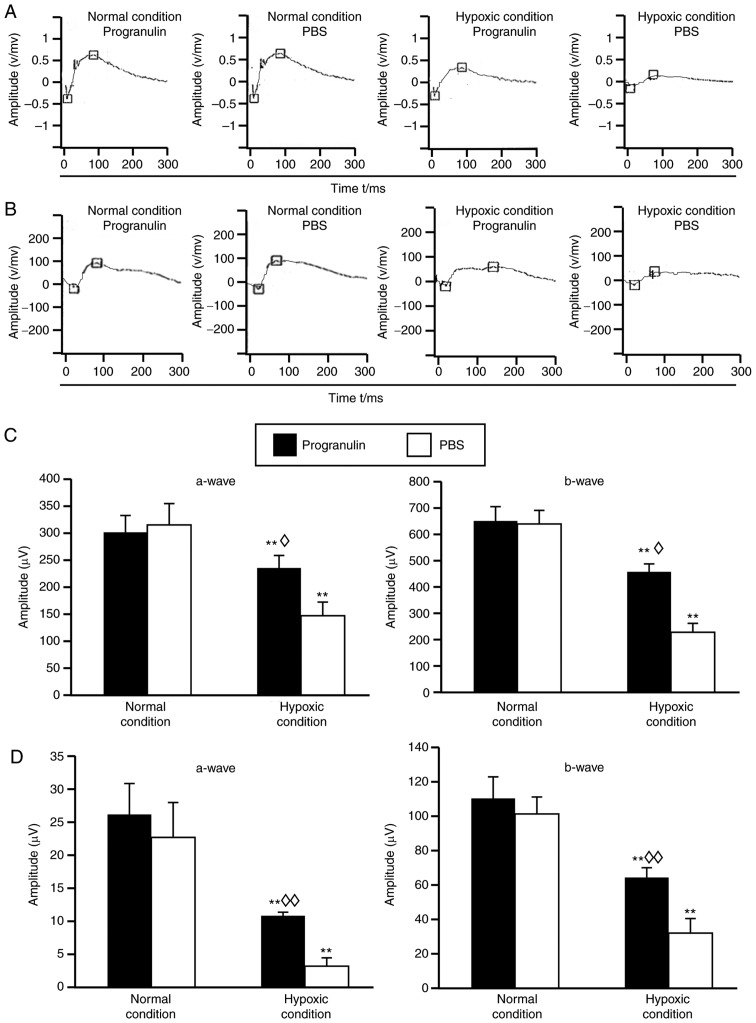
Figure 2.
ERGs of mice following intravitreal injection of exogenous progranulin under hypoxic conditions. Typical waveforms of the (A) scotopic and (B) photopic ERGs under normal and hypoxic conditions. Statistical analysis of the (C) scotopic ERG and (D) photopic ERG. **P<0.01 vs. the normal condition; ◊P<0.05, ◊◊P<0.01 vs. the PBS group. Data are presented as means ± standard error of the mean, n=12. ERG, electroretinogram; OD, oculus dexter, the right eye; OS, oculus sinister, the left eye.

