Fig. 3.
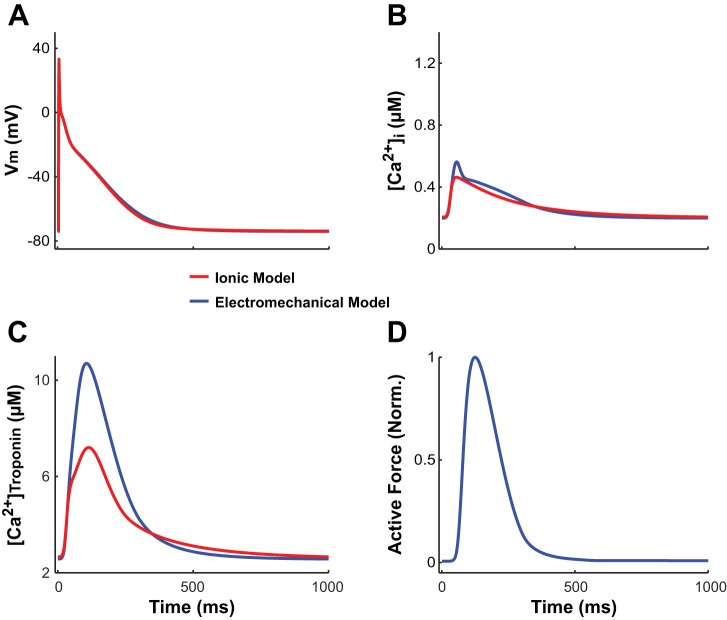
A–C: transmembrane voltage (Vm; A), free intracellular Ca2+ concentration ([Ca2+]i; B), and total Ca2+ bound to troponin C ([Ca2+]troponin; C) plotted over time for our electromechanical model (blue) and the uncoupled ionic model of the normal right atrial (RA) myocyte (red), with both isometrically paced to steady state at a cycle length (CL) of 1,000 ms and sarcomere length (SL) of 2.4 µm. D: normalized active force plotted only over time for our electromechanical model.

