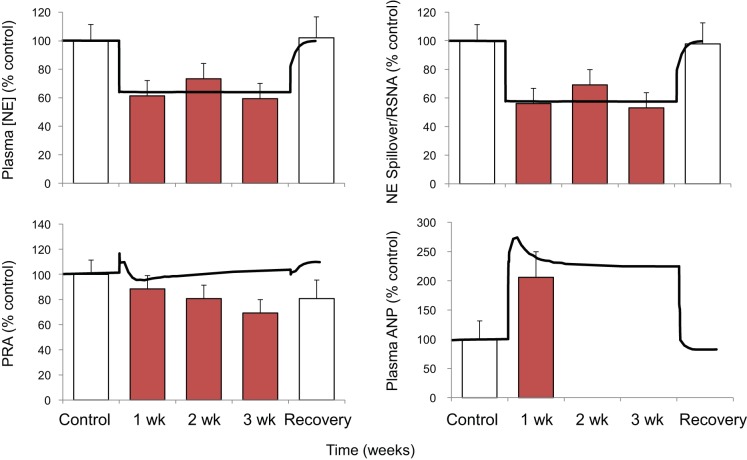
Fig. 2.
Changes in plasma concentrations of norepinephrine (NE) and atrial natriuretic peptide (ANP), plasma renin activity (PRA), and either NE spillover (red bars) or renal sympathetic nerve activity (black line) during 3 wk of baroreflex activation. Red bars indicate experimental data. Values are means ± SE; n = 6 dogs. Black lines show the results from the simulation.

