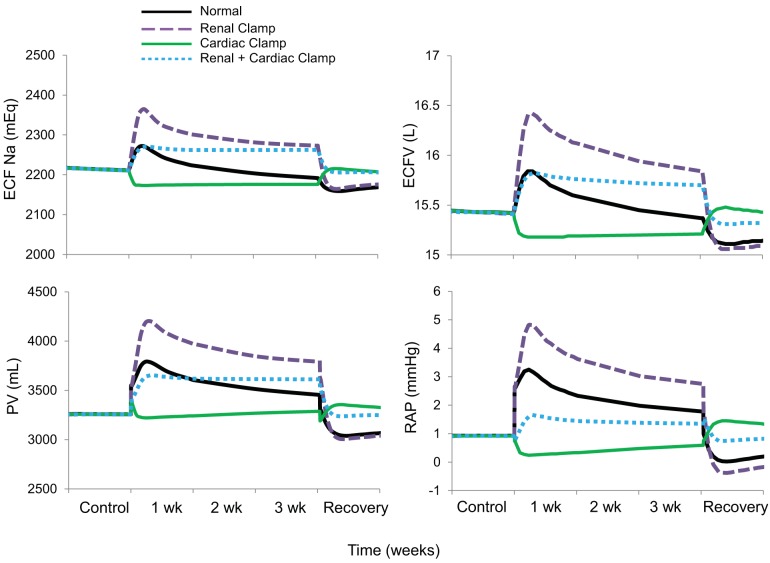
Fig. 4.
The four simulations described in Fig. 3 showing changes in extracellular fluid (ECF) Na+, extracellular fluid volume (ECFV), plasma volume (PV), and right atrial pressure (RAP) during 3 wk of baroreflex activation. Simulations are 1) for normal conditions (normal), 2) without suppression of renal sympathetic outflow (renal clamp), 3) without changes in cardiac autonomic activity (cardiac clamp), and 4) without suppression of renal sympathetic outflow and without changes in cardiac autonomic activity combined (renal + cardiac clamp).

