Figure 3.
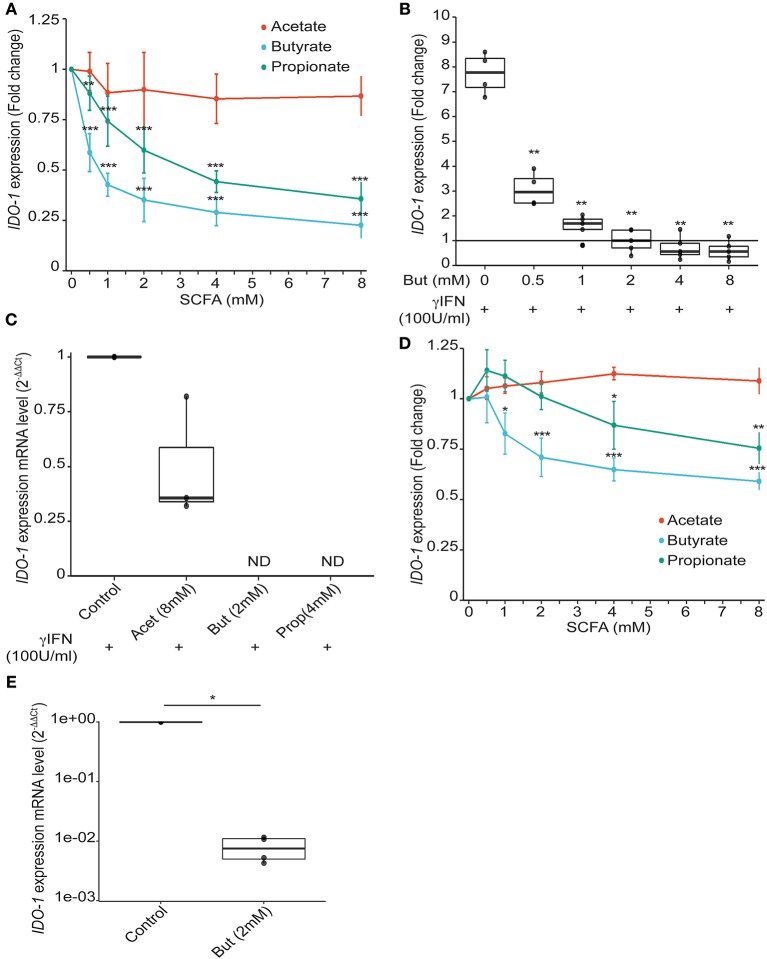
Impact of SCFAs on IDO-1 expression. (A), HT-29-IDO-1 reporter cells were incubated with a range of concentration of acetate, butyrate and propionate (0.5; 1; 2; 4; 8 mM) for 24 h. IDO-1 expression was measured by luciferase activity and expressed as the mean ± SD fold change toward un-stimulated cells (N > 3). (B), HT-29-IDO-1 reporter cells were incubated with IFNγ (100 U/ml) and a range of concentration of butyrate (0.5–8 mM). IDO-1 expression was measured by luciferase activity and expressed as the median ± quartiles of fold change toward un-stimulated cells (N > 3). (C) IDO-1 gene expression on HT-29 exposed for 6 h to IFNγ (100 U/ml) +/– butyrate (2 mM), propionate (4 mM), or acetate (8 mM) was determined by RT-PCR. Results were normalized to GAPDH and expressed as 2-ΔΔ Ct relative to control mean value; ND: not detected (N = 3). (D) Caco2-IDO-1 reporter cells were incubated with a range of concentration of acetate, propionate and butyrate (0.5; 1; 2; 4; 8 mM). IDO-1 expression was measured by luciferase activity and expressed as the mean ± SD fold change toward un-stimulated cells (N > 3). (E) IDO-1 expression level on human colonic epithelial cells treated for 24 h with butyrate compared to non-treated cells from the same patient was determined by RT-PCR. Results are normalized to RPS17 and expressed as 2-ΔΔ Ct relative to control, median ± quartiles (N = 4). P-value: *P < 0.05, **P < 0.005, ***P < 0.001.

