
Figure 2.
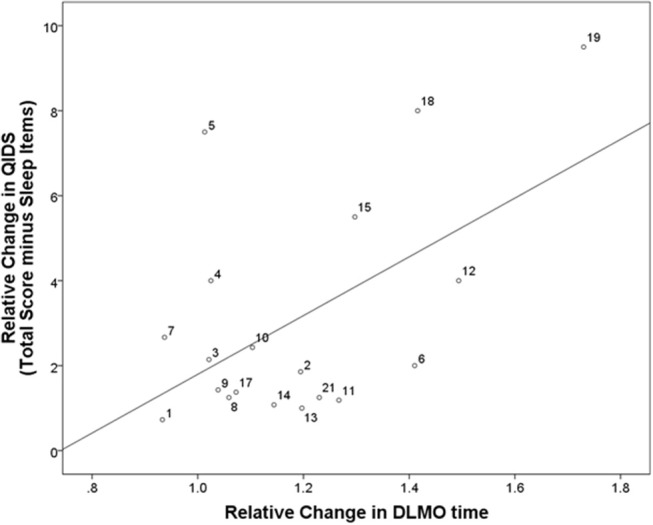
Correlation between relative changes in depressive symptoms and relative changes in DLMO. Correlation between relative changes in depressive symptoms and circadian phase from baseline (i.e., before intervention start) to follow-up (i.e., after 8 weeks of intervention). QIDS, quick inventory of depressive symptoms; DLMO, dim light melatonin onset. Participant identification numbers indicated next to each data point can be matched to Supplementary Figures 1, 2 showing individual raw data at each time point for each participant.