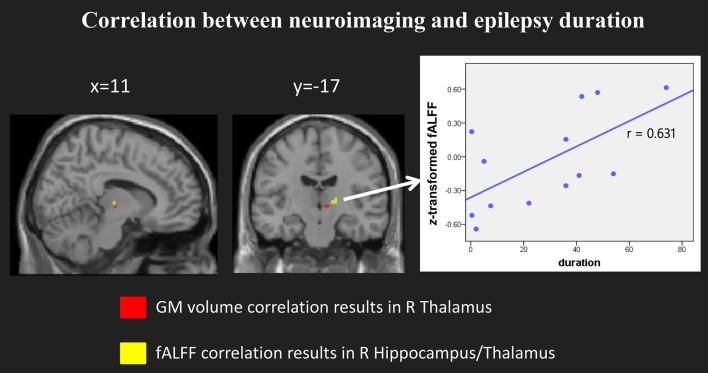
Figure 5.
Significant correlation between the fALFF and epilepsy duration. (Left) panel showed the location of the clusters with significant correlation in both model imaging. (Right) panel showed the scatter plots and the direction between the normalized fALFF of right hippocampus/thalamus and epilepsy duration.

