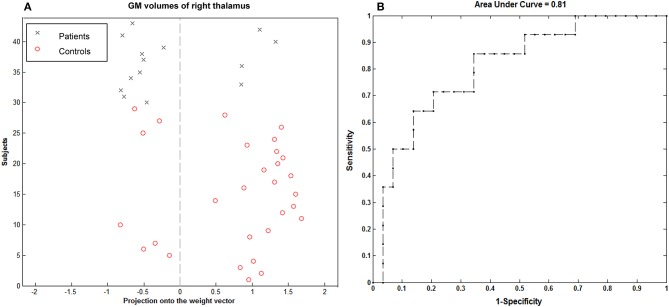
Figure 6.
Classification plot (A) and receiver operating characteristic curve (B) for the comparison between 14 children with GTCS and 29 healthy controls using GM volume from right thalamus of T1-weighted images. This yielded a total accuracy of 74.42% (75.86% sensitivity, 71.43% specificity), statistically significant at P < 0.002.

