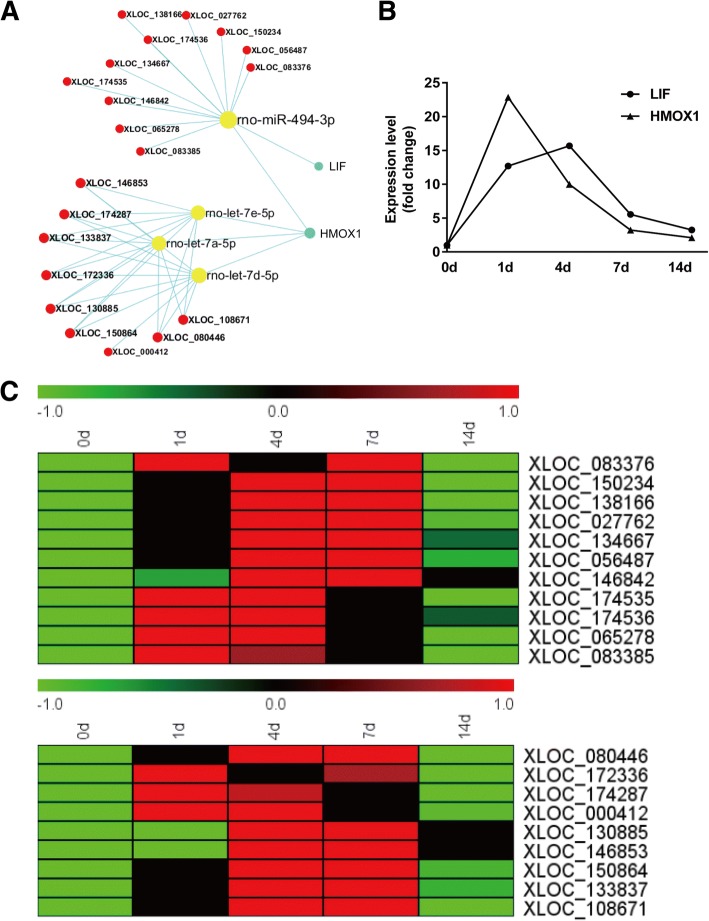
Fig. 5.
ceRNA network of LIF and HMOX1. a Interactions of RNAs in LIF and HMOX1-associated ceRNA network. b Expression levels of mRNAs LIF and HMOX1 from RNA sequencing outcome. c Heatmap and hierarchical clustering of lncRNAs in LIF and HMOX1-associated ceRNA network. Red color indicated up-regulation while green color indicated down-regulation

