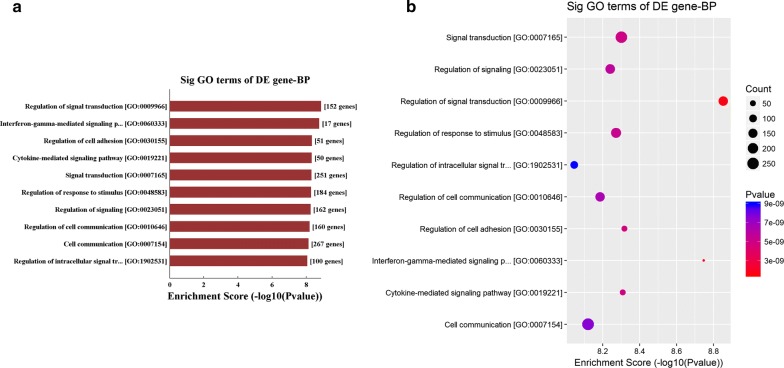
Fig. 3.
Pathway analysis of EMI-related circRNAs and genes. a, b GO analysis of all 663 upregulated genes in EMI versus non-EMI AML samples. The activated biological processes related to EMI were principally involved in cell–cell crosstalk, including cell adhesion (GO:0030155; GO:0007155), migration (GO:0016477; GO:0030334), signal transduction (GO:0009966; GO:0007165) and cell–cell communication (GO:0010646; 0007154). The X-axis represents the ratio of enriched differential genes (a, b). The Y-axis shows the names of process that were significantly enriched (a, b). The size of each node represents the number of enriched differential genes, and the p-values are indicated by color changes from red to purple (b). Downregulated genes were not associated with specific EMI-related processes

