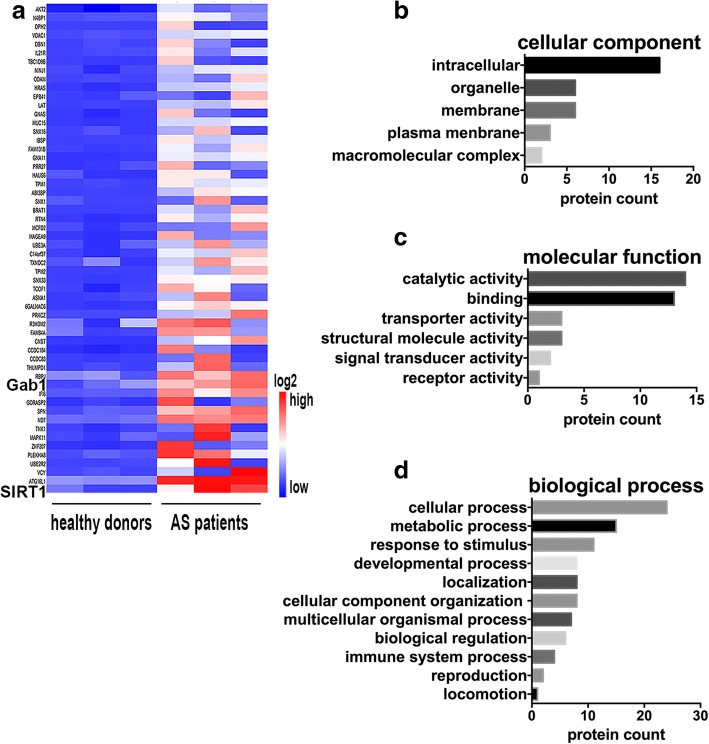
Fig. 1.
Proteomic analysis of sera from AS patients. a. Heat map representing the 56 protein candidates targeted by IgG antibodies in AS patient sera with 4-fold or greater expression (P < 0.05) compared with healthy donors. The classification and clustering of different categories of cellular component (b), molecular function (c) and biological process (d) of all identified proteins were analyzed using PANTHER databases

