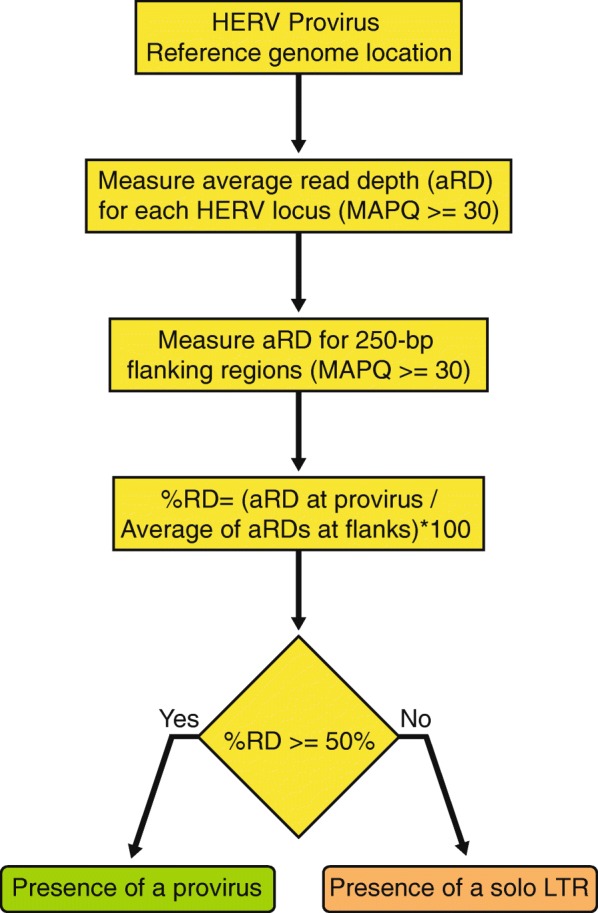
Fig. 4.

Flowchart of findsoloLTR pipeline. The first step indexes the coordinates of proviruses of a HERV family in the reference genome. Average of read depth (of mapping quality score (MAPQ) equal or greater than 30 and base call accuracy equal to or greater than 20) at the HERV locus and at the flanking window extending ±250-bp from both LTRs are calculated. Percentage of the average read depth at each HERV locus to the average of the read depths at the two flanking 250-bp window is assessed. An estimated percentage equal to or greater than 50% is used to infer the presence of a provirus and the percentage lower than 50% infer the presence of a solo LTR allele
