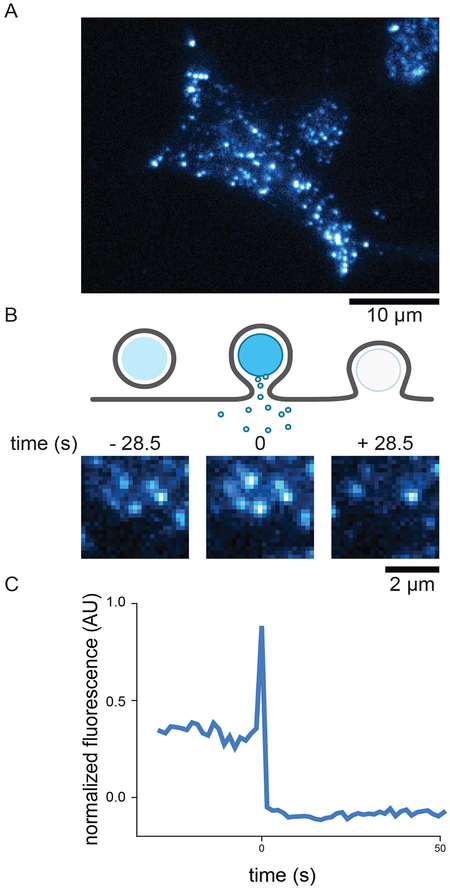
Figure 2:
Representative images of labeled dense-core vesicles in INS-1 cells visualized with TIRF microscopy. A) A TIRF micrograph of an INS-1 cells transfected with NPY-GFP. Diffraction limited spots are vesicles resting near the bottom cell membrane within the evanescent illumination field. The contrast of the image has intentionally been adjusted much higher than normal for print clarity which causes the diffuse background within the cell body. B) A cartoon of exocytosis, shown as a side view of a vesicle resting near the membrane. Upon exocytosis the vesicular and plasma membranes fuse to release cargo. After exocytosis, vesicle fluorescence has been lost. Below the cartoon are representative images of a single dense-core vesicle undergoing exocytosis. The vesicle is present prior to fusion (left frame, vesicle at center), its intensity increases dramatically upon fusion (middle frame), and is then lost rapidly (right frame). D) Fluorescence intensity trajectory extracted from the image sequence in B. The intensity is background subtracted and normalized as described in the text

