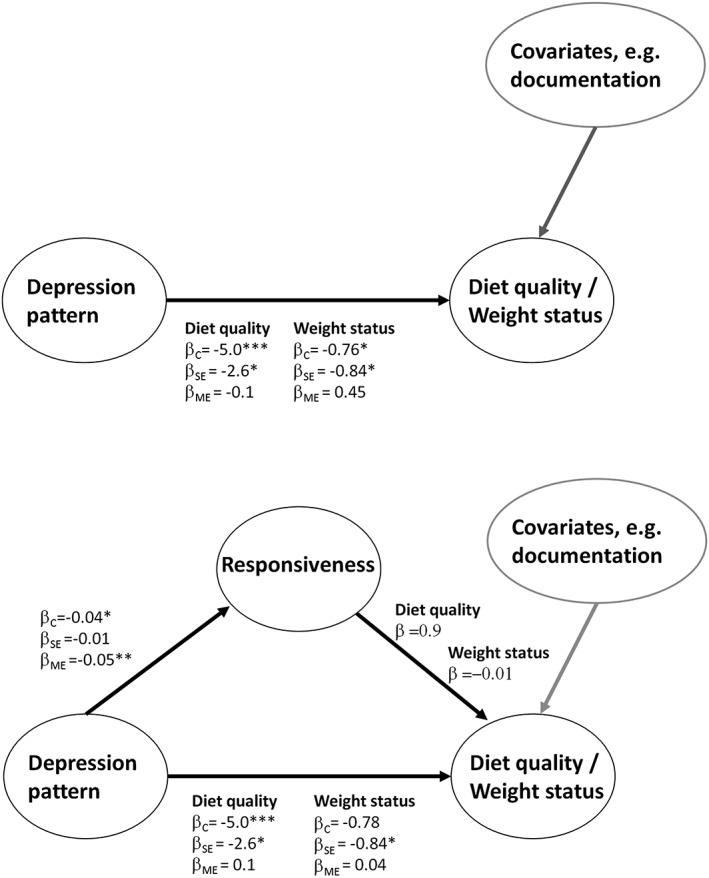
Figure 3.

Path diagrams for mediational analysis of the direct pathway (above) and the mediated pathway (below). β indicates the regression coefficient and the subscript indicates depression group (C = chronic, SE = severe episodic, and ME = moderate episodic); * for p < .05, ** for p < .01, and *** for p < .001
