EXHIBIT 2.
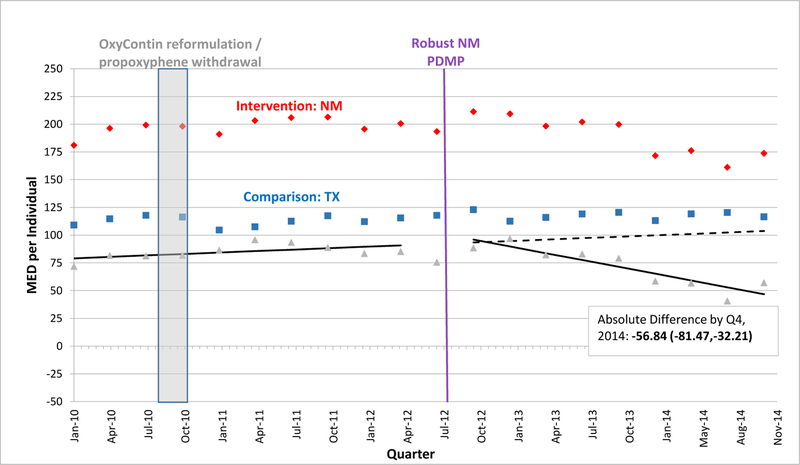
Morphine Equivalent Dosage Dispensed per Individual per Quarter in New Mexico versus Texas, 2010–2014
SOURCE: Authors’ analysis of Optum data (OptumInsight, Eden Prairie, MN), 2010–2014.
NOTES: Abbreviations: PDMP, prescription drug monitoring program; MED, morphine equivalent dosage in milligrams; Q, quarter. A fitted regression line shows the difference between adjusted intervention state (red) and comparison state (blue) quarterly values in the baseline period, and continues as a predicted regression line in the follow-up period, after robust PDMP implementation in the intervention state. We calculated regression lines using population-level interrupted time series linear models, after adjusting for individual age, gender, race/ethnicity, education-level, and poverty-level at each quarter using the STATA margins command. We provide the absolute difference between intervention and comparison state levels by the fourth quarter of 2014 with a 95% confidence interval as an estimate of policy effect.
A vertical bar shows when two national interventions associated with decreases in opioid-related overdoses and prescribing occurred during the fourth quarter of 2010: reformulation of OxyContin to a tamper-resistant extended-release form and withdrawal of propoxyphene from the market.

