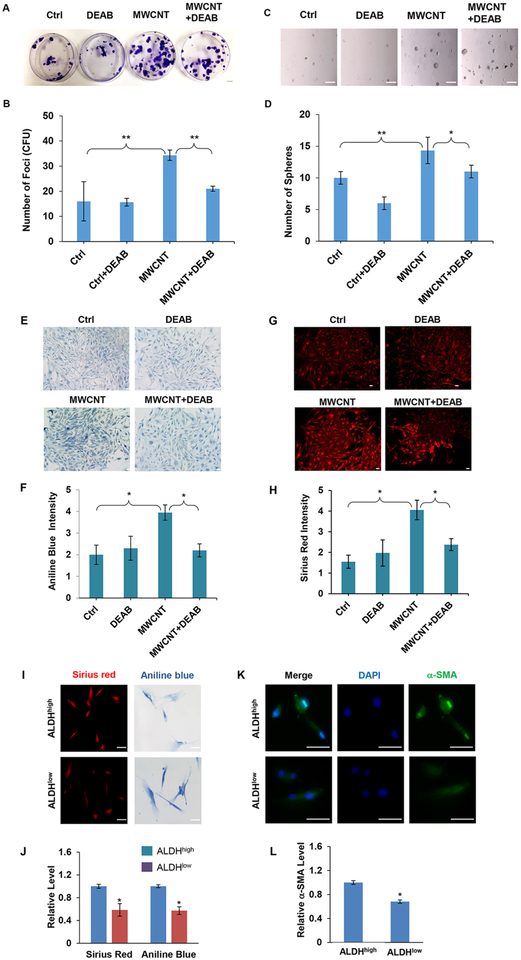
Figure 3.
ALDH inhibitor DEAB inhibits MWCNT-induced focus and sphere formation and ALDH regulates fibrogenic activity of MWCNT-treated lung fibroblasts. (A) Representative images and (B) quantification of focus formation in control and MWCNT-treated NHLFs. Cells were treated with MWCNT (0.16 μg/cm2) in the presence or absence of DEAB (50 μM) for 14 days and analyzed for focus formation.(C) Representative images and (D) quantification of sphere formation in control and MWCNT-treated NHLFs. Cells were similarly treated with the test agents and allowed to grow under nonadherent, stem cell-selective conditions for 14 days and analyzed for sphere formation. Scale bar is 100 μm. *p < 0.05, **p < 0.001 versus Ctrl, n = 3. (E–H) Representative images and quantification of collagen content in focus-forming cells stained with Trichrome (aniline blue) and Sirius red. NHLFs were treated with MWCNT (0.16 μg/cm2) in the presence or absence of DEAB (50 μM) for 14 days and analyzed for collagen content. Scale bar is 100 μm. (I,J) Representative images and quantification of collagen content in sorted ALDHhigh and ALDHlow cells. NHLFs were treated with MWCNT (0.16 μg/cm2) for 72 h and analyzed for ALDH activity by flow cytometry-based Aldeflour assay. The cells were sorted by FACS and analyzed for collagen content by aniline blue and Sirius red staining. Scale bar is 100 μm. (K,L) Representative images and quantification of αSMA expression in the sorted cells stained with αSMA antibody by immunofluorescence. Quantitation of staining was performed using an image analysis software. Scale bar is 50 μm. *p < 0.05 versus Ctrl, n = 3.

