Fig. 2.

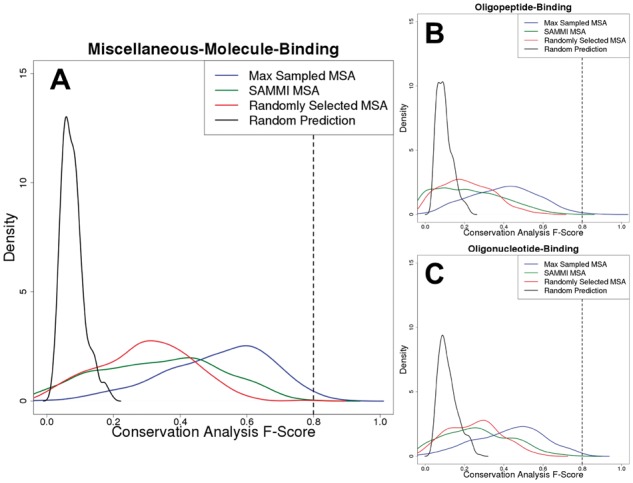
Sequence conservation-based binding site residue predictions can approach the practical upper limit of binding site definition. Conservation analysis F-Score distributions for the three datasets used in this work (A: miscellaneous-molecule-binding, B: oligopeptide-binding, C: oligonucleotide-binding) are plotted for the Max Sampled MSAs (blue), SAMMI MSAs (green) and randomly selected MSAs (red). Specifically, the red curve was obtained by plotting the distribution of average F-Scores resulting from conservation analysis of 100 randomly selected sampled MSAs for each protein. In addition, a background F-Score distribution (black) representing the likelihood of selecting functional residues by chance was obtained by randomly selecting a number of residues (with relative solvent-accessibility greater than zero) equal to the number of annotated functional residues for each protein and averaging the resulting F-Score over 264 trials. The dashed lines at F-Scores of ∼0.8 indicate the approximate theoretical upper limit that was established by analysis of the agreement between different databases. The plotted density functions are accurate representations of the underlying data (Supplementary Fig. 2)
