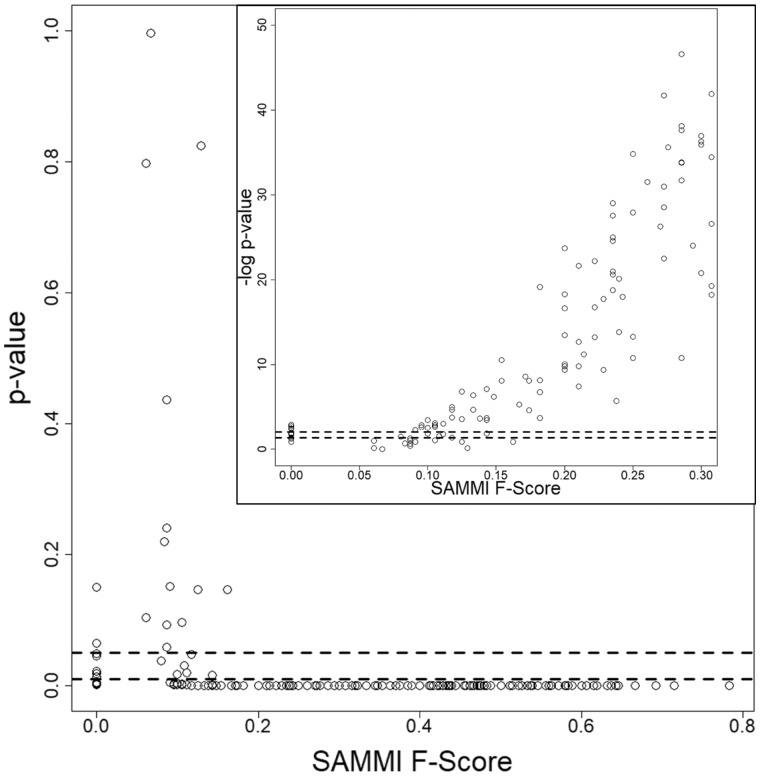
Fig. 4.
Statistical significance of SAMMI MSA F-Scores obtained for the set of 275 misc.-molecule-binding proteins. Each point represents the P-value obtained for an individual protein’s SAMMI F-Score. The plot shows that P-values drop sharply after the F-Score reaches 0.20. The inset shows the negative base 10 logarithm of the P-values and demonstrates a corresponding monotonically rising trend. The cluster of P-values at F-Scores of 0 indicates the statistical significance of these predictions as well; for these cases, it is likely that the SAMMI MSA conservation pattern detects a secondary binding site or unannotated functional residues. The dashed lines indicate P-values of 0.05 and 0.01 (-log10 applied in inset). Similar plots were obtained for the oligopeptide-binding and oligonucleotide-binding datasets. Plotting the P-values of random MSA selection F-Scores would also show a similar drop at an F-Score value of 0.25

