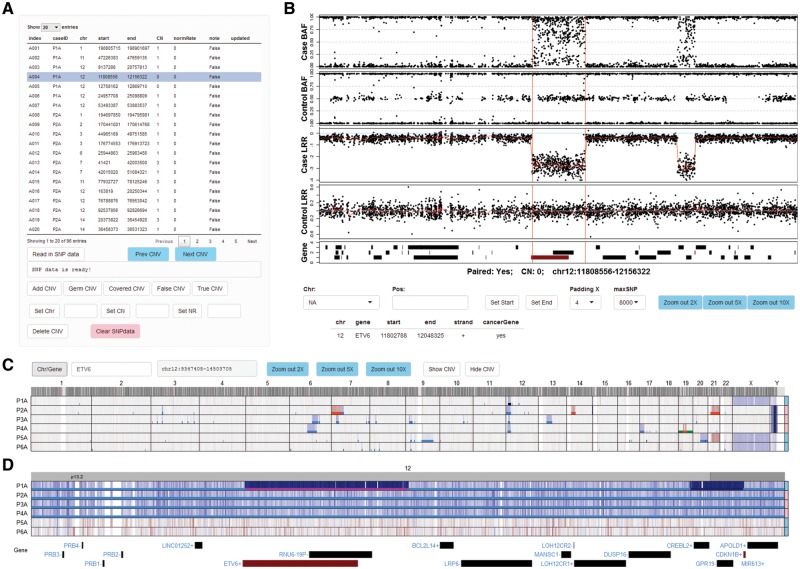
Fig. 1.
Viewing and annotation of CNVs by ShinyCNV. A, Table of CNVs. This table is imported from reported CNVs by OncoSNP (Yau et al., 2010): index, user defined CNV identifier; CN, copy number; normRate (NR), normal sample contamination rate, estimated by OncoSNP and can be marked as 0 if unknown. The CNVs are noted as ‘False’ initially and need manual review. Any modification of this table would trigger update to a backup file. B, B allele frequency (BAF) and log R ratio (LRR) of each probe for case and matched control samples. X axis shows the chromosome position. For LRR, the two-copy regions should be around 0, which means normal, and the higher and lower LRR intensity indicates copy number gain and loss, respectively. For BAF, the SNPs should be clustered along Y axis at 0, 0.5 and 1 for two-copy regions, while other types of clustering would indicate copy number changes. When a CNV region is selected, BAF and LRR around this region will be plotted for case and control samples, with the reported CNV region marked by two vertical red lines. RefSeq genes are shown at the bottom panel, and the ones reported as consensus cancer genes according to COSMIC database are in red. Detailed gene information can be seen by clicking the gene bars. For CNVs reported with incorrect breakpoints, users can click the BAF/LRR figure (with SNPs around) and the nearest SNP’s chromosome coordination will be shown in ‘Pos:’ input box, and then the selected CNV’s start or end position can be updated by clicking ‘Set Start’ or ‘Set End’. Drop-list ‘Padding X’ is provided to adjust the length of padding regions around the CNV; ‘maxSNP’ is available to customize the maximum number of SNPs shown in each BAF/LRR panel. The figure can be zoomed in by mouse-swiping in the panel, and zoom out by clicking the ‘Zoom out *X’ buttons. C, Normalized SNP intensity (LRR) spectrum for all the analyzed cases. Chromosomes are labeled on the top and case IDs are at the left side. Cases’ genders are annotated at the right side, with pink for female and skyblue for male. Probe intensity is corresponding to DNA copy, which is shown in blue and red to indicate potential copy number loss and gain, respectively. Two buttons are provided to show (‘Show CNV’) or hide (‘Hide CNV’) the imported CNVs in different colors: copy-neutral loss of heterozygosity in green, one copy loss in light blue, two-copy loss (0 copy left) in dark blue, one copy gain in red and two or more copy gain in dark red. The selected CNV is highlighted in magenta as shown in Figure 1D. D, Zoomed-in view of a cancer gene ETV6. Users can zoom in to specific chromosome, region and gene through the input box ‘Chr/Gene’. Mouse-swiping zoom in and button supported zoom out are only available within chromosome range. An online tutorial is available at https://github.com/gzhmat/ShinyCNV

