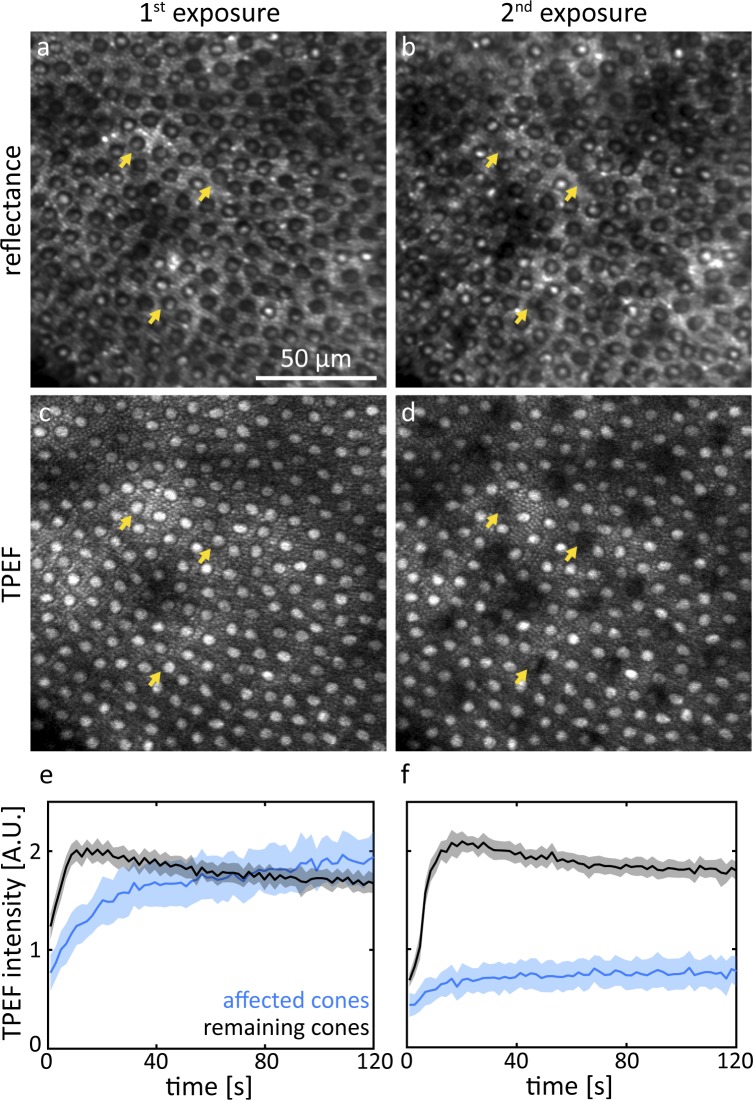
Figure 2.
Representative reflectance and TPEF images of the same retinal location ∼15° from the fovea taken during the first exposure of 856 J/cm2 (a, c) and the immediate follow-up (2nd exposure: b, d). The yellow arrows indicate affected cones that appeared decreased in diameter. Cones that emit less TPEF (e, f) during the 2nd exposure also appear structurally affected in the reflectance image. Shaded areas represent SD.

