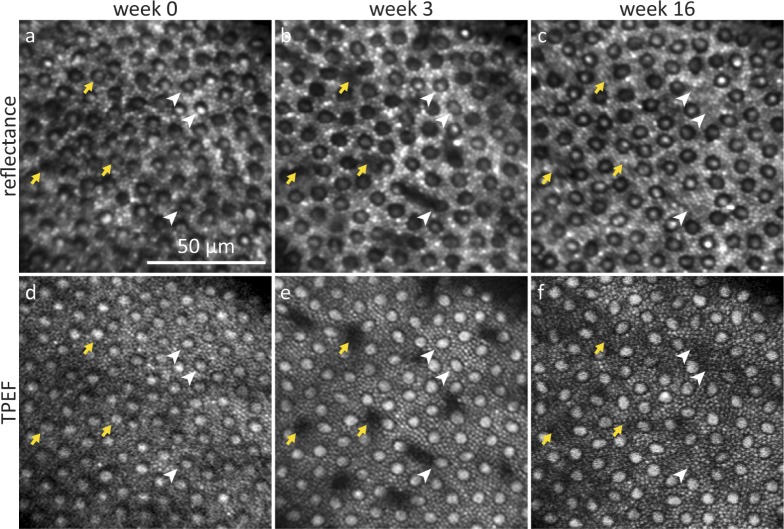
Figure 6.
Representative reflectance and TPEF images of selective cone degeneration and photoreceptor rearrangement in the near-periphery. Images were taken at the same retinal location during the 856 J/cm2 exposure (a, d), in week 3 (b, e) when cone outer segments were degenerating and in week 16 (c, f) when the surrounding rods had rearranged. The yellow arrows mark cones that were affected by the exposure in week 0, white arrowheads mark 3 cones that degenerated after week 3.

