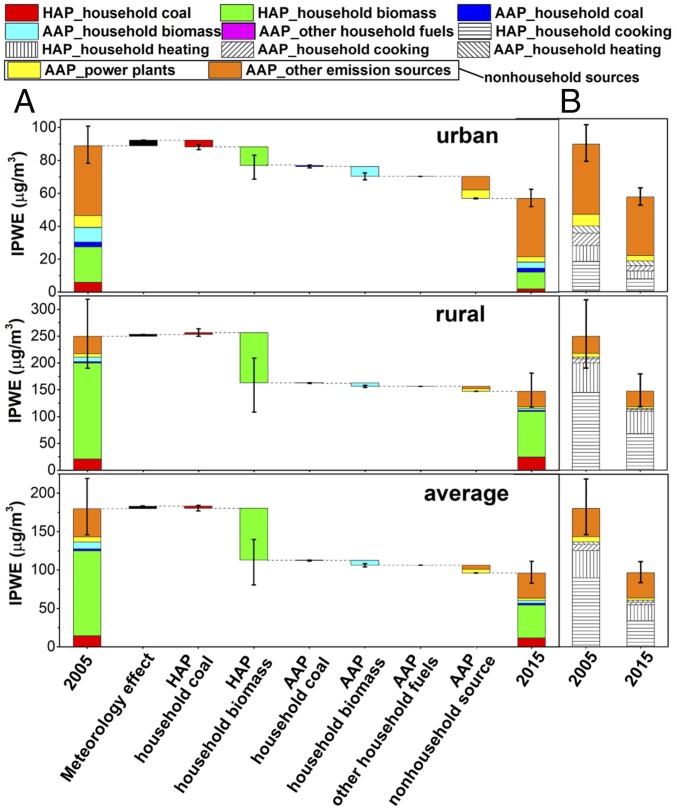
Fig. 3.
Contribution of individual sources to IPWE and its changes in China. (A) Contribution of each household-fuel type and nonhousehold sources to IPWE in 2005/2015 (leftmost and rightmost stacked columns) and the changes between the 2 y (in-between columns) in urban (Top), rural (Middle), and all (Bottom) areas. (B) Contribution of household fuels used for cooking/heating and nonhousehold sources to IPWE in 2005/2015. The error bars denote 95% confidence intervals estimated by using the Monto Carlo method.

