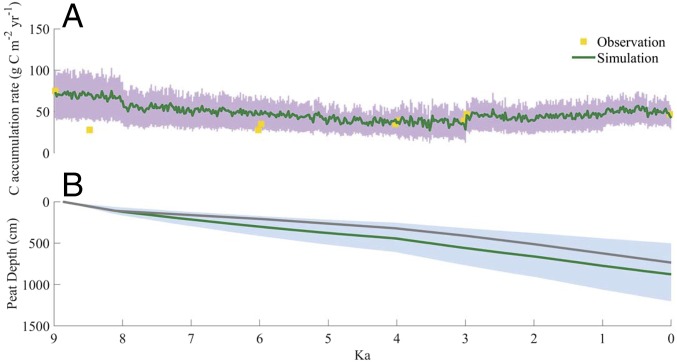
Fig. 2.
Comparison between simulation and measurement (14) at the Aucayacu site: SOC accumulation rates (A) and peat depth (B). Shaded areas represent the range due to uncertainties from the posterior distributions of the parameters after the parameterization. A value of 0 cm at ∼9 ka indicates no peat accumulation.

