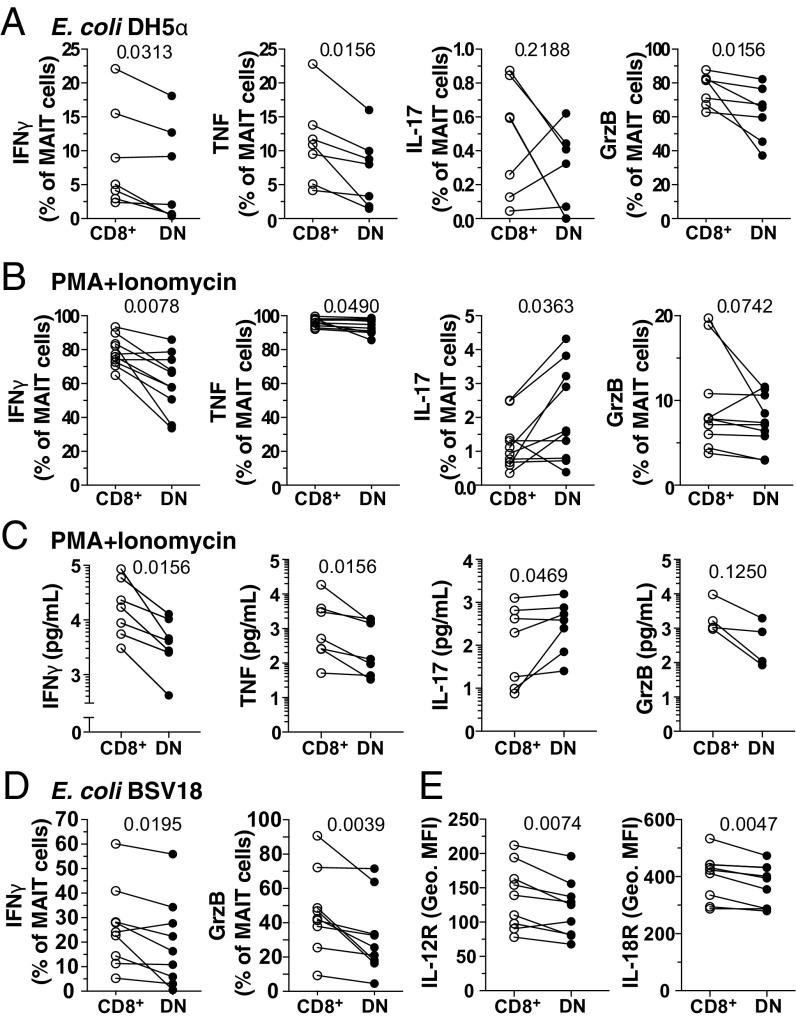
Fig. 3.
DN MAIT cells display less functional capacity following bacterial and mitogenic stimulation than CD8+ MAIT cells. Percentage of FACS-sorted CD8+ and DN MAIT cells expressing IFN-γ, TNF, IL-17, and GrzB after stimulation with (A) E. coli for 24 h (n = 7) and (B) PMA/ionomycin for 6 h (n = 10). (C) Concentration of IFN-γ, TNF, IL-17, and GrzB after stimulation with PMA/ionomycin for 6 h (n = 4–7). (D) Expression of IFN-γ and GrzB by MAIT cells within bulk PBMC culture in the presence of RibA− E. coli BSV18 (n = 9). (E) Expression levels (geometric MFI) of IL-12R and IL-18R in resting CD8+ and DN MAIT cells (n = 9). Lines in the graphs represent individual donors. The Wilcoxon’s signed-rank test was used to detect significant differences between paired samples, except for IFN-γ, TNF, and IL-17 in the PMA/ionomycin stimulation where the paired t test was used.

