Fig. 4.
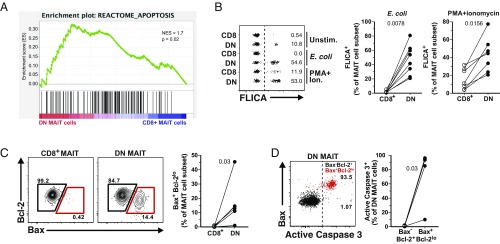
DN MAIT cells are more prone to apoptosis than CD8+ MAIT cells. (A) Gene-set enrichment summary plot for CD8+ MAIT cell versus DN MAIT cell differentially expressed ranked genes and a defined set of genes associated with an apoptosis signature. (B) Representative example of FLICA expression in FACS-sorted CD8+ and DN MAIT cells in the absence of stimulation, or after E. coli- or PMA/ionomycin-mediated stimulations (Left). Summary data with the percentage of stimulated CD8+ and DN MAIT cells expressing FLICA (Right). (C) Representative FACS plots and the frequency of Bax and Bcl-2 expression in resting CD8+ and DN MAIT cells. (D) Representative FACS plot and expression of active caspase 3 in Bax+Bcl-2lo (red gate) DN MAIT cells. Data are from seven (A), eight (B; E. coli), seven (B; PMA/ionomycin), and six (C and D) donors. Lines in the graphs represent individual donors. The Wilcoxon’s signed-rank test was used to detect significant differences between paired samples. NES, normalized enrichment score.

