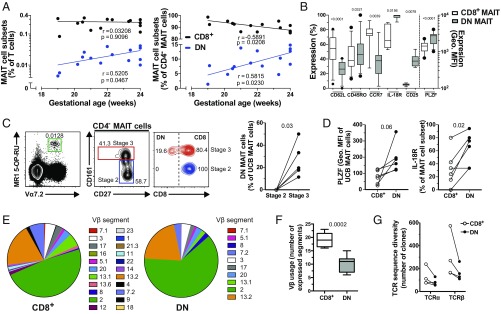
Fig. 5.
Fetal DN MAIT cells express a more mature phenotype and adult DN MAIT cells express a more restricted TCR repertoire than their CD8+ counterparts. (A) Correlations between the fetal gestational age and the levels of fetal splenic CD8+ and DN MAIT cells as a proportion of T cells (Left) and of CD4− MAIT cells (Right). (B) Expression of CD62L, CD45RO, CCR7, IL-18Rα, CD25, and PLZF in fetal splenic CD8+ and DN MAIT cells. Percentage of cells expressing each of these markers, except for PLZF for which the geometric MFI of the staining is shown. (C) Representative example of the identification of stage 2 and stage 3 MAIT cells from UCB and their CD8 expression, and the percentage of DN MAIT cells within each developmental stage. (D) PLZF and IL-18R expression by CD8+ and DN UCB MAIT cells. (E) Median percentage of adult circulating CD8+ and DN MAIT cells expressing each TCR Vβ segment. (F) Number of TCR Vβ segments expressed by adult circulating CD8+ and DN MAIT cells. (G) TCR-α and TCR-β sequence diversity of CD8+ and DN MAIT cells as determined by RNA sequencing. Data are from 15 donors (A); 11 (B; CD62L and CD45RO), 9 (B; CCR7), 7 (B; IL-18R), 8 (B; CD25), and 12 (B; PLZF) donors (B); 6 donors (C and D); 16–19 (E; CD8+ MAIT) and 14–17 (E; DN MAIT) donors (E); 9 (F; CD8+ MAIT) and 7 (F; DN MAIT) donors (F); and 4 donors (G). The box-and-whisker plots show the median, the 10th and 90th percentiles, and the IQR. Correlations were calculated using the Spearman’s test. The Wilcoxon’s signed-rank test was used to detect differences between paired samples for IL-18R, CCR7, CD25 (B) and in C, and the paired t test was used for the remainder (B and D). The unpaired t test was used to detect significant differences between unpaired samples (F).

