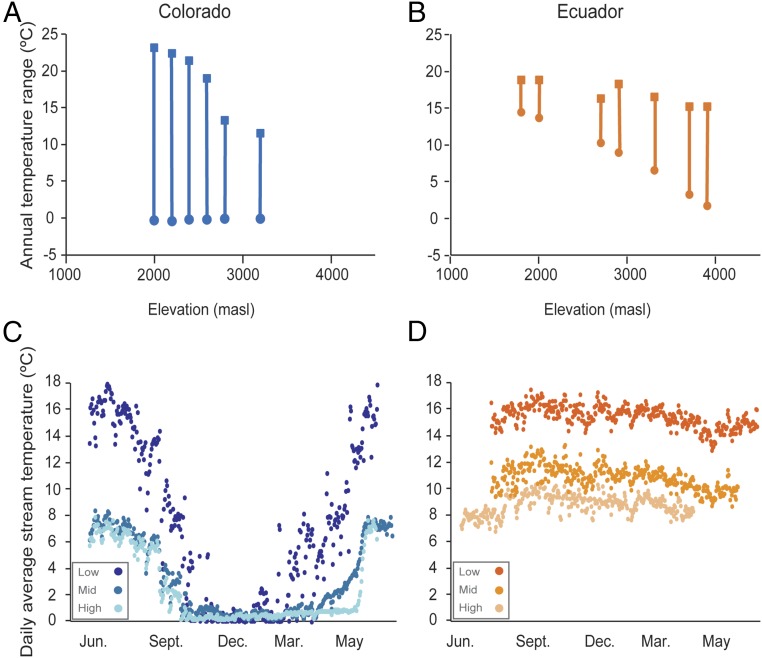
Fig. 1.
Variation in annual temperature overlap and stream temperature profiles for temperate and tropical streams. Annual maximum (squares) and minimum (circles) temperatures show that temperate streams (A) have greater annual temperature variation than tropical streams (B). Temperature profiles (daily average temperature over 1 y) at low, mid-, and high elevation streams show that temperate streams (C) show higher seasonal variance than tropical ones (D) at all elevations.

