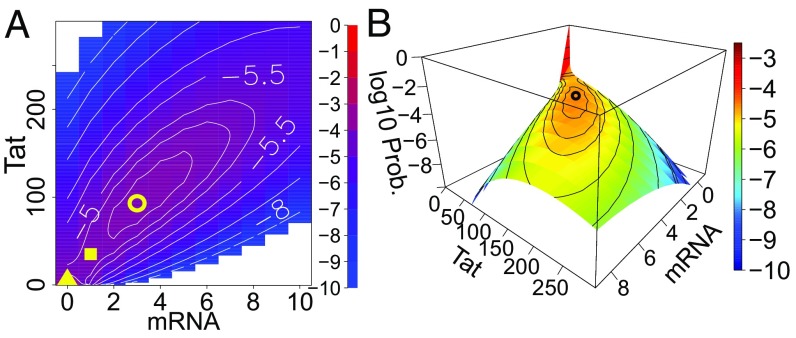
Fig. 2.
Bimodal steady-state probability landscape of HIV Tat circuit. (A) Top view of the 2D steady-state landscape. The contour lines show the probability in log scale. The yellow triangle indicates the location of probability peak of latency, the yellow circle indicates the location of the probability peak of activation, and the yellow square indicates the stochastic separatrix state. (B) Perspective view of the 2D steady-state landscape. The yellow triangle in the bottom left corner of A corresponds the high peak of latency shown in red in B.

