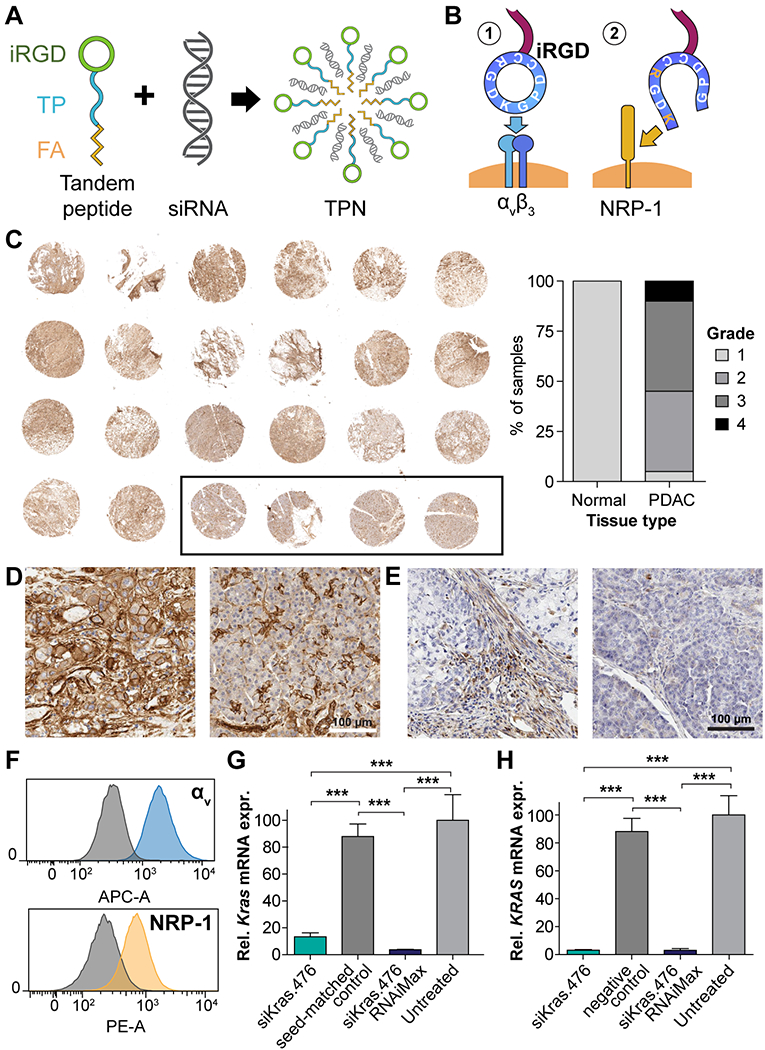
Figure 1: Design, suitability, and in vitro function of iRGD TPNs for PDAC.

(A) Schematic depicting spontaneous formation of iRGD-based tumor-penetrating nanocomplexes (TPNs) by mixing tandem peptides and siRNA solutions (B) iRGD functions by binding to αvβ3/5 integrins when cyclized and by binding neuropilin-1 (NRP-1) following proteolytic cleavage. (C) Left: Immunohistochemical stain of PDAC tissue microarray (TMA) at low magnification, showing distribution of αv integrins (brown), with hematoxylin counterstain (purple). Black outline designates 4 normal pancreatic samples. Core diameter: 1.5 mm. Right: Grading of TMA overall staining intensity via objective digital quantification. (D) Micrograph of PDAC (left) and normal pancreas (right) from the above TMA showing detail of αv integrin distribution. Scale bar: 100 µm. (E) Micrograph of NRP-1 distribution in PDAC (left) and normal pancreas (right). Scale bar: 100 µm. (F) αv integrin and neuropilin-1 surface expression on murine Kras-p53 PDAC cell line B22, quantified by live-cell flow cytometry, compared to IgG control plus secondary antibody (gray histograms). (G) Kras mRNA knockdown in KP B22 cells using siKras.476, versus seed-matched control, as measured by qPCR. (H) KRAS mRNA knockdown in the human PANC1 PDAC cell line.
