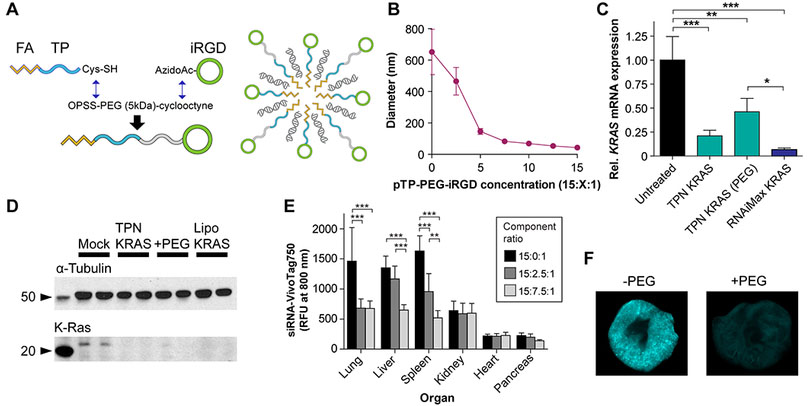
Figure 2. In vitro and in vivo characterization of iRGD TPNs formulated with PEG.

(A) Summary of chemical synthesis of transportan-PEG-iRGD and schematic of PEGylated iRGD TPN. (B) iRGD TPN hydrodynamic diameter as a function of PEG content, determined by dynamic light scattering. (C) in vitro mRNA knockdown in MiaPaCa-2 cells by non-PEGylated and PEGylated iRGD TPNs, with lipofectamine siKRAS as positive control; expression relative to TBP (TATA-binding protein) housekeeping control. (D) Western blot depicting knockdown of K-Ras protein in PANC-1 cells by non-PEGylated and PEGylated iRGD TPNs, with lipofectamine siKRAS as positive control. (E) Organ biodistribution of siRNA delivered by systemically-injected PEGylated vs. plain iRGD TPNs, performed in healthy wildtype mice (n=5 per condition). **: p<0.01 and ***: p<0.001 by two-way ANOVA. Unmarked comparisons within each organ are non-significant. (F) Comparison between lungs of animals dosed with PEGylated TPNs (above) and plain TPNs (bottom), pseudocolored based on near-infrared siRNA intensity.
