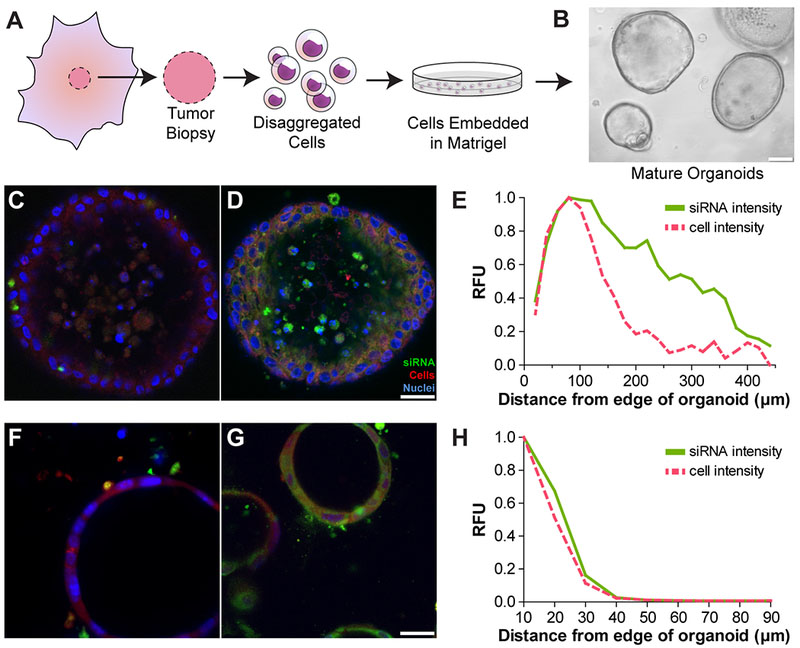
Figure 3. siRNA penetration modeled in 3D organoids.

(A) Schematic of organoid production from human tumors. (B) Brightfield micrograph of mature organoids at 10× magnification; scale bar: 100 µm. (C and D) 20× fluorescent micrographs of human organoids after incubation with (C) non-targeted PEG TPNs and (D) PEG iRGD TPNs. Fluorescently-tagged siRNA shown in green, cytoplasmic dye in red, and nuclei in blue; scale bar: 25 µm. (E) Quantification of siRNA intensity in a human organoid as a function of distance from the outer edge, representing penetration of the siRNA. Cytoplasmic dye intensity reflects the reference density of cells. (F and G) 20× fluorescent micrographs of mouse cell line-derived organoids after incubation with (F) siRNA only and (G) PEG iRGD TPNs. Fluorescently-tagged siRNA shown in green, constitutive tdTomato in red, and nuclei in blue; scale bar: 25 µm. (H) Quantification of siRNA intensity in a murine organoid as a function of distance from the outer edge, representing penetration of the siRNA.
