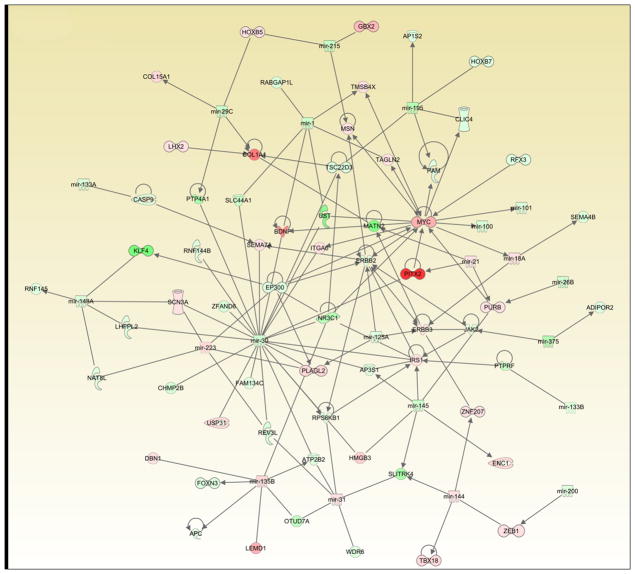
Figure 3.
Network interaction map based on combined miRNA expression (Table 1), target prediction and mRNA expression data for all tumor and normal samples. “Red” indicates up-regulation, “green” indicates down-regulation in the tumors compared to the corresponding normal tissue. Precise description of shapes, lines and arrows can be found in Supplementary Figure legend 4-1.

