
Figure 2.
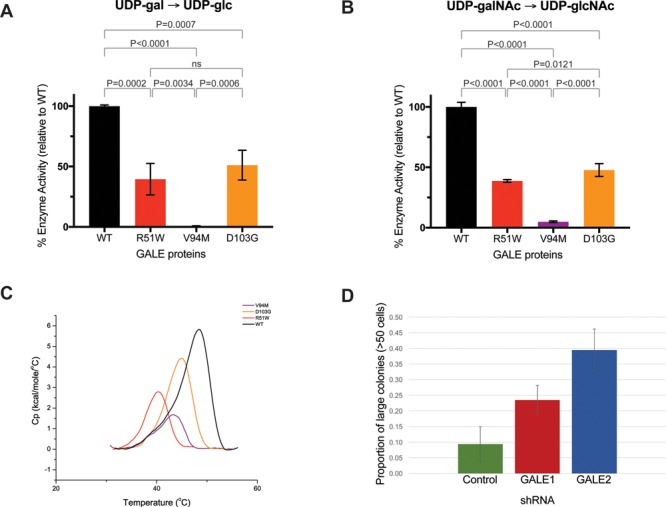
Enzyme activity and differential scanning calorimetry. Enzyme assays in figures (A) and (B) were performed with 10-ng protein. Substrates were (A) UDP-galactose or (B) UDP-N-acetylgalactosamine. Enzyme activities were measured as fraction product (Supplementary Material, Table S2) and were normalized to wildtype protein measurements. The mean values of normalized enzyme activities were plotted + standard deviation for each allele. Experiments were performed in at least triplicate (23,28,29). (C) Representative endotherm plots for each GALE allele. Endotherm data was normalized for protein concentration, with intrascan baseline correction. Black indicates wildtype protein (normal), red indicates GALE p.R51W, purple indicates GALE p.V94M and orange indicates GALE p.D103G. (D) Size distributions of megakaryocyte colonies after treatment of CD34+ hematopoietic progenitor cells with control or anti-GALE shRNA probes. Cells were plated in MegaCult collagen-based media. Slides were fixed, stained and classified by colony size. Data represents two independent experiments, each with plating and counting in duplicate.