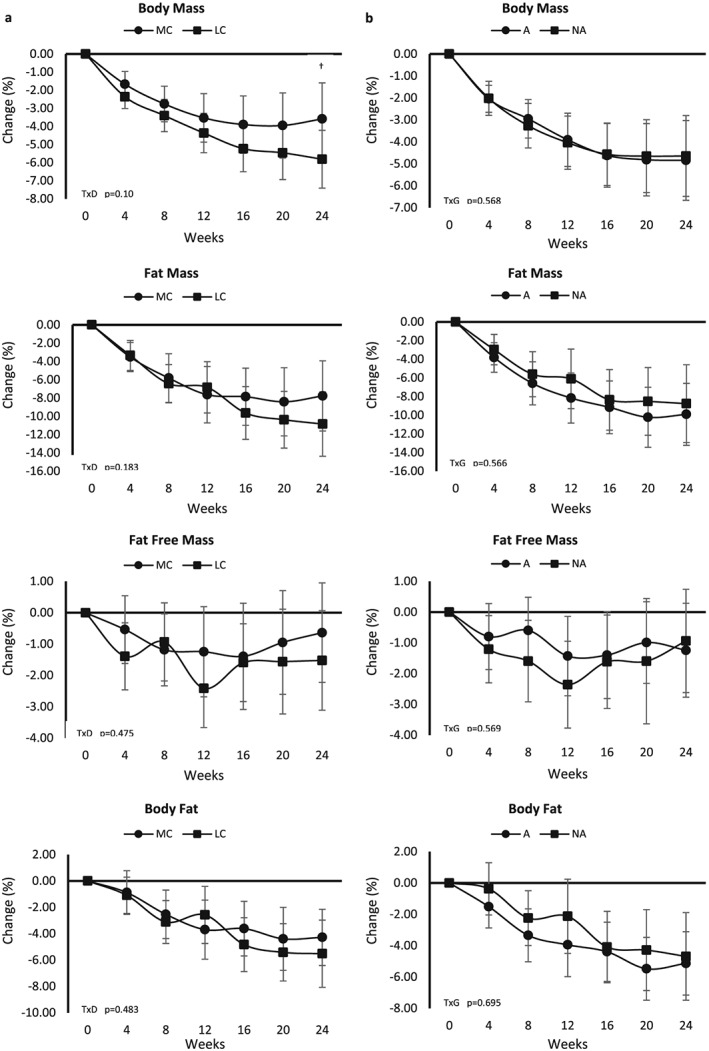
Figure 3.

Per cent changes from baseline with 95% confidence intervals in body composition variables between diet groups (a) and genotype groups (b). A, diet aligned to genotype; D, diet; G, genotype; LC, lower carbohydrate; MC, moderate carbohydrate; NA, diet not aligned to genotype; T, time.
