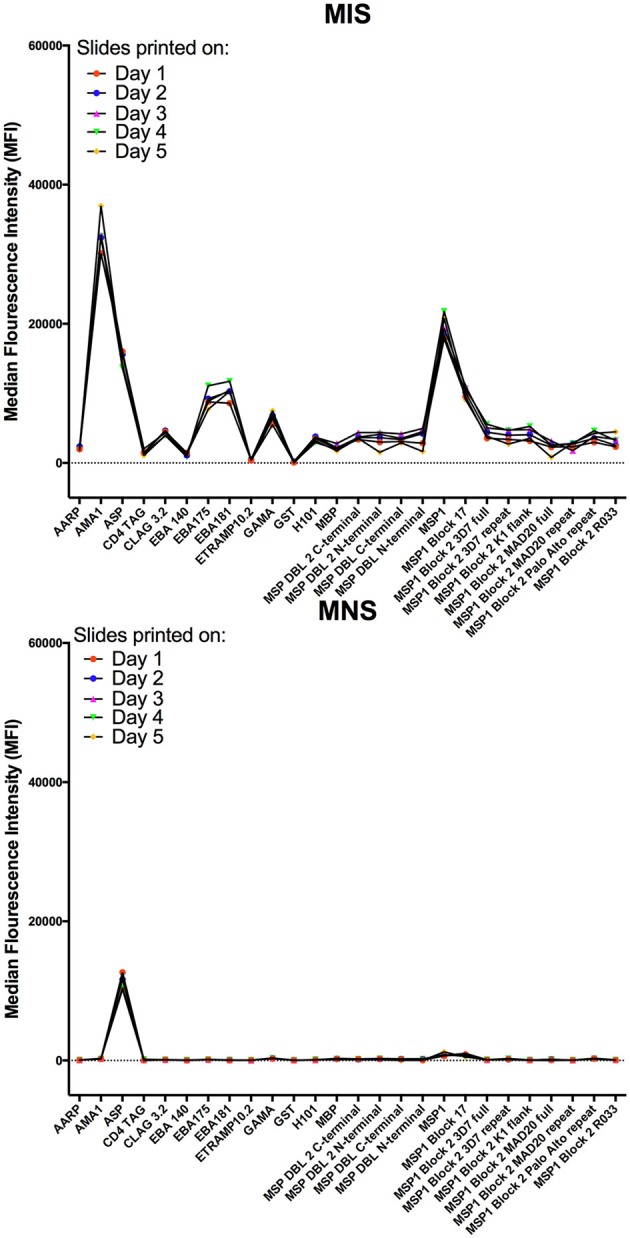
Figure 6.

Inter-assay variability of antibody detection by KILchip v1.0. Positive and negative controls were used to measure antibody responses to 5 protein arrays printed on 5 consecutive days using identical printing conditions and the same batch of recombinant proteins. Data presented are the mean MFI values of triplicate readings obtained with MIS (top graph) and MNS (bottom graph) to a subset of the proteins (n = 26) printed on each mini-array. Individual proteins are represented as dots and lines have been included to aid visualization.
