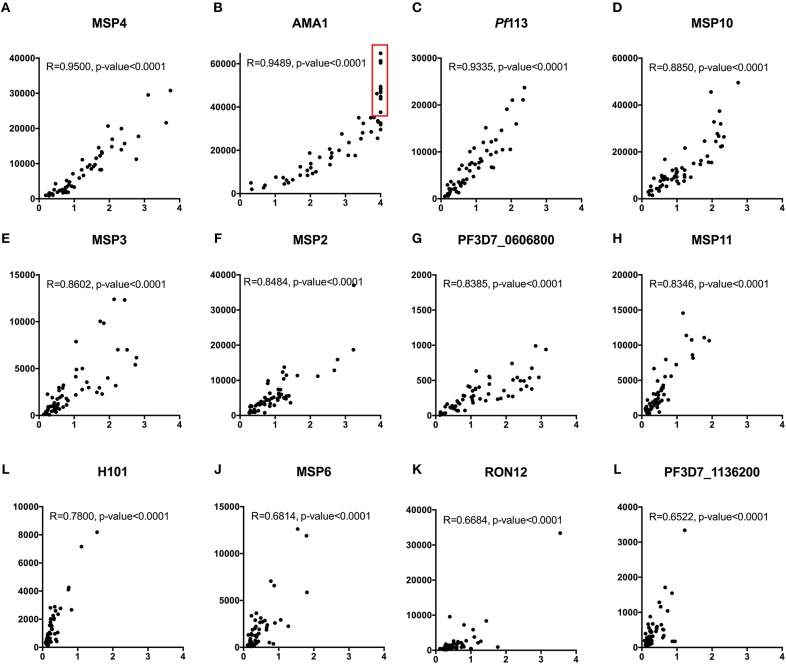
Figure 8.
Concordance between KILchip v1.0 and the gold standard ELISA. A comparison of antibody responses to 12 antigens measured simultaneously in KILchip v1.0 and individually by ELISA. Sixty-six serum samples from adults living in the malaria endemic region of Kilifi, Kenya were used to facilitate comparisons. A strong positive correlation of >0.8 was observed in 8 of the antigens (A–H) while four antigens (I–L) showed a correlation coefficient between 0.65 and 0.78. Red box - serum samples in which antibody responses reached the upper limit of detection when measured by ELISA, yet distinguishable by microarray with MFI values ranging from 40,000 to 60,000.

