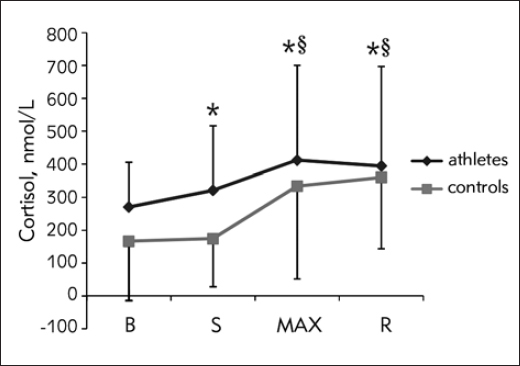
Figure 1.

Cortisol response during CPET (data presented with actual values)
B, baseline; S, start of the test; MAX, point of maximal strain; R, 3rd minute of recovery; *, significant change compared to the previous time point; §, significant difference in response between groups.
