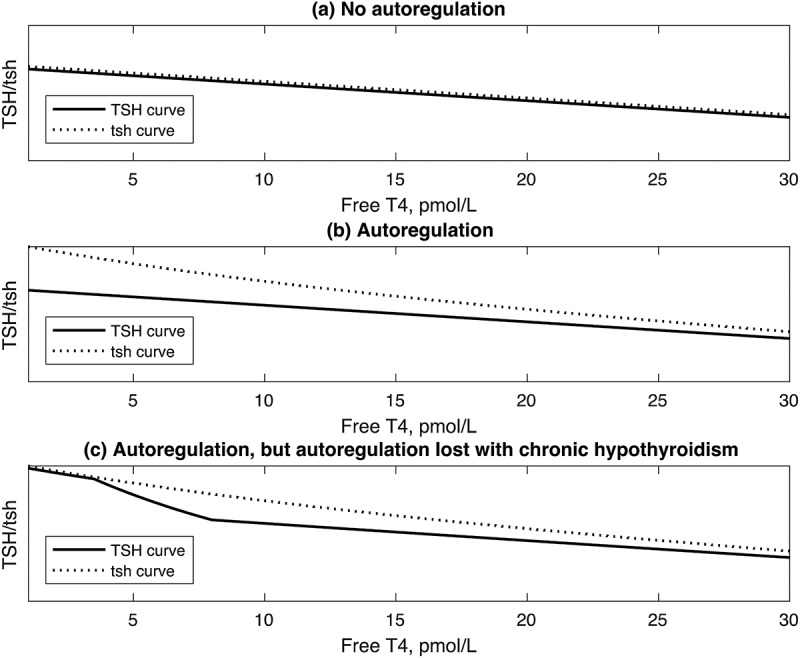
Figure 5.

The extension of the logic of Figure 3 to show the different relationships between the TSH curve and the tsh curve depending on the presence or absence of autoregulation. (a). TSH and tsh curves identical in the absence of autoregulation. (b). TSH curve lies below tsh curve in the presence of autoregulation. (c). TSH curve below tsh curve at normal/high values of FT4, but becomes identical to tsh curve at low values of FT4, when autoregulation is present but lost at low values of FT4 in chronic hypothyroidism.
