
Figure 2.
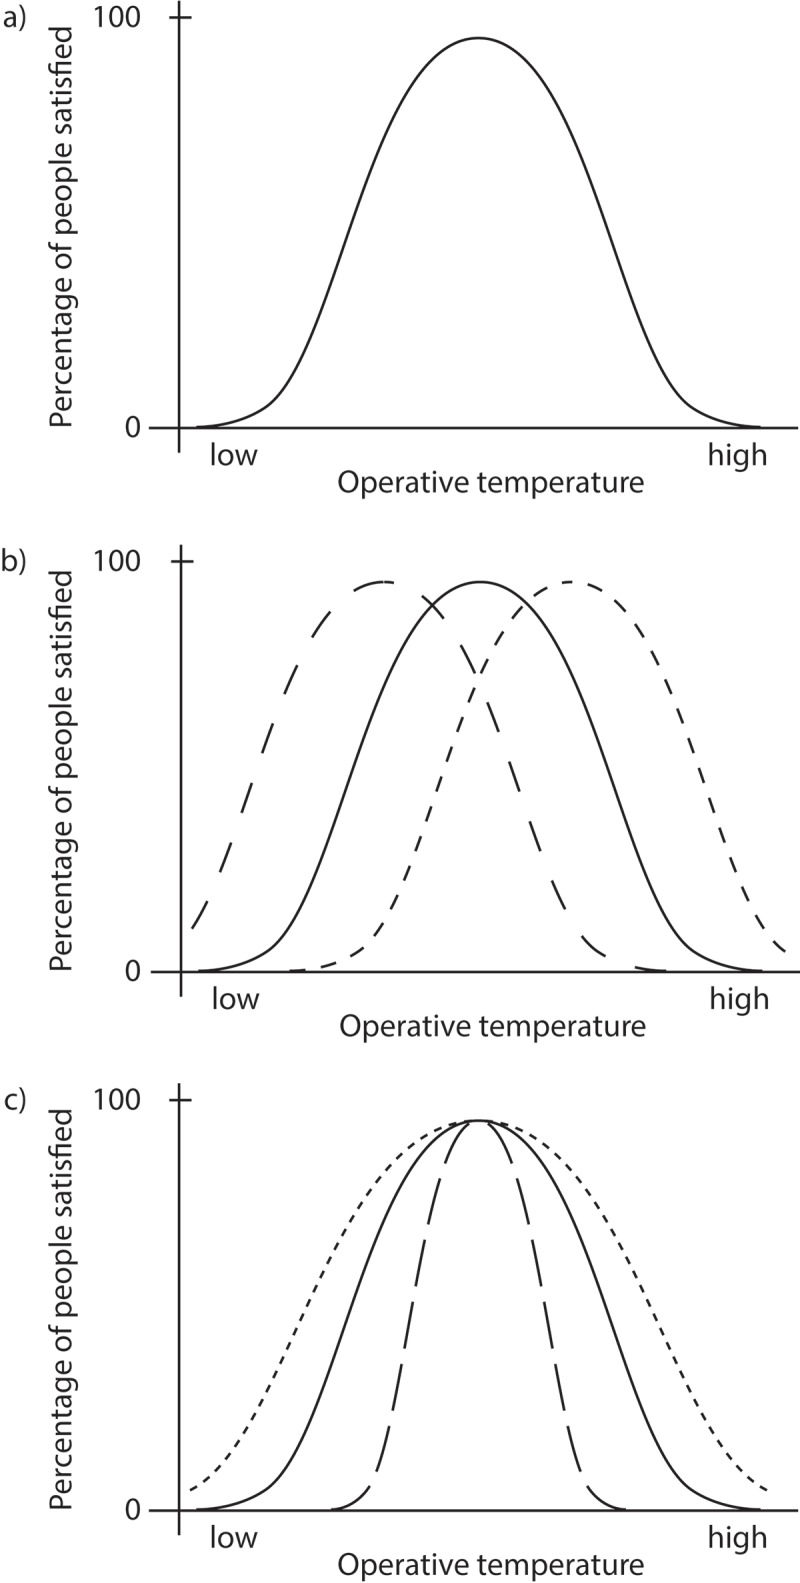
Influences on the relationship between physical conditions and the percentage of people satisfied. Inter- or intrapersonal differences in physiological, psychological, and/or context related drivers can lead to (b) a shift of the PPS-curve to the left or right and/or (c) a wider/narrower curve.