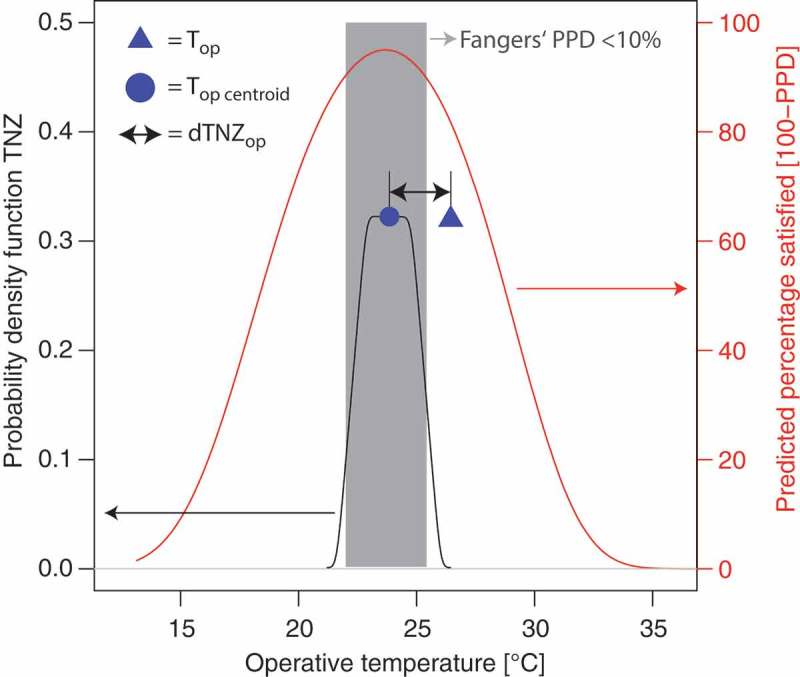
Figure 3.

Relationship between probability density function (pdf) of solutions for TNZ, Top centroid and dTNZop, pdf of TNZ and PPS curve. The pdf (black line) is for a standard female person. The red line shows the predicted percentage of satisfied (PPS), which is the inverse of the predicted percentage of dissatisfied (PPD), as defined by Fanger [8]. The PPS line is based on the same environmental conditions as the pdf-lines. The gray area shows the range of Top, which is related to a PPD by Fanger below 10%.
