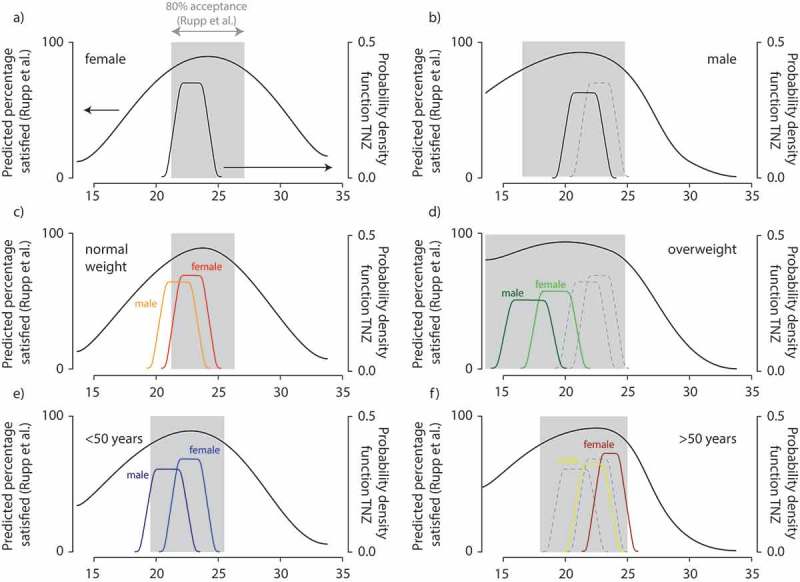
Figure 4.

Comparison between findings by Rupp et al. [80] (bold black lines and shaded areas) and the results of the pdfTNZ approach (gray dashed lines are pdfTNZ’s from left side of figure to ease comparison).

Comparison between findings by Rupp et al. [80] (bold black lines and shaded areas) and the results of the pdfTNZ approach (gray dashed lines are pdfTNZ’s from left side of figure to ease comparison).