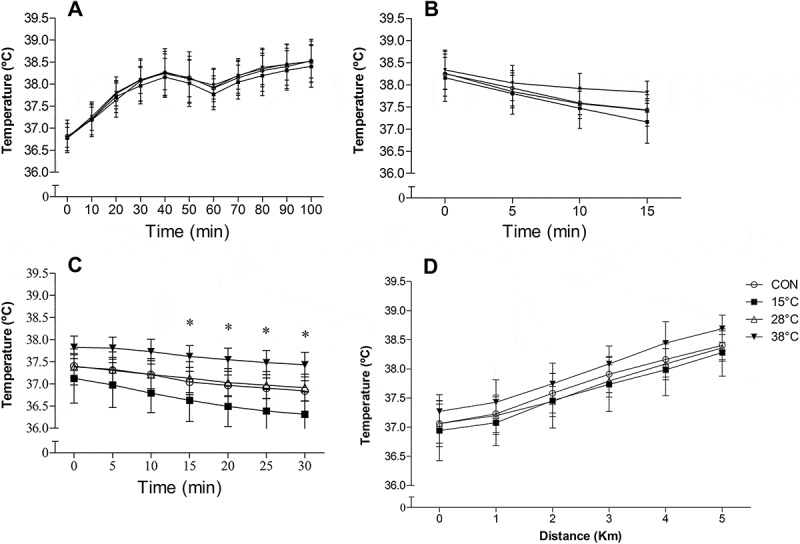
Figure 3.

Rectal temperature during RUN (a), recovery by WI (b), post WI (c) and at each kilometer covered during the 5-km time trial (d). Data expressed as mean ± SD. CON, control. n = 9. *p < .05, 15°C compared to CON, Two-way ANOVA, Tukey’s post hoc.
